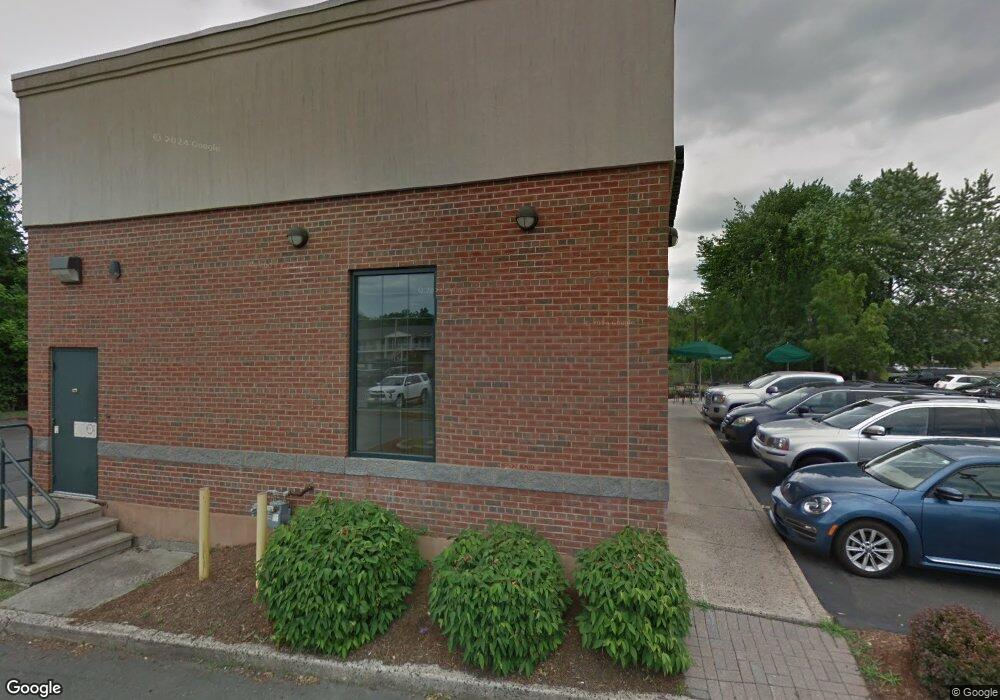
613 Queen St Southington, CT 06489
East Southington NeighborhoodEstimated Value: $1,764,483
--
Bed
--
Bath
1,347
Sq Ft
$1,310/Sq Ft
Est. Value
About This Home
This home is located at 613 Queen St, Southington, CT 06489 and is currently estimated at $1,764,483, approximately $1,309 per square foot. 613 Queen St is a home located in Hartford County with nearby schools including Reuben E. Thalberg Elementary School, Joseph A. Depaolo Middle School, and Southington High School.
Ownership History
Date
Name
Owned For
Owner Type
Purchase Details
Closed on
Feb 14, 2024
Sold by
Jj Tic Llc
Bought by
Mocha Yemen Llc
Current Estimated Value
Home Financials for this Owner
Home Financials are based on the most recent Mortgage that was taken out on this home.
Original Mortgage
$750,000
Outstanding Balance
$736,721
Interest Rate
6.6%
Mortgage Type
Stand Alone Refi Refinance Of Original Loan
Estimated Equity
$1,027,762
Purchase Details
Closed on
Jun 19, 1992
Sold by
First Prop Lp
Bought by
Queen St Corp
Home Financials for this Owner
Home Financials are based on the most recent Mortgage that was taken out on this home.
Original Mortgage
$203,819
Interest Rate
8.67%
Mortgage Type
Commercial
Create a Home Valuation Report for This Property
The Home Valuation Report is an in-depth analysis detailing your home's value as well as a comparison with similar homes in the area
Home Values in the Area
Average Home Value in this Area
Purchase History
| Date | Buyer | Sale Price | Title Company |
|---|---|---|---|
| Mocha Yemen Llc | $1,500,000 | None Available | |
| Jj Tic Llc | -- | None Available | |
| Mocha Yemen Llc | $1,500,000 | None Available | |
| Queen St Corp | $250,000 | -- |
Source: Public Records
Mortgage History
| Date | Status | Borrower | Loan Amount |
|---|---|---|---|
| Open | Mocha Yemen Llc | $750,000 | |
| Closed | Mocha Yemen Llc | $750,000 | |
| Previous Owner | Queen St Corp | $13,000 | |
| Previous Owner | Queen St Corp | $441,911 | |
| Previous Owner | Queen St Corp | $203,819 |
Source: Public Records
Tax History Compared to Growth
Tax History
| Year | Tax Paid | Tax Assessment Tax Assessment Total Assessment is a certain percentage of the fair market value that is determined by local assessors to be the total taxable value of land and additions on the property. | Land | Improvement |
|---|---|---|---|---|
| 2025 | $14,663 | $441,510 | $253,350 | $188,160 |
| 2024 | $13,881 | $441,510 | $253,350 | $188,160 |
| 2023 | $13,404 | $441,510 | $253,350 | $188,160 |
| 2022 | $12,861 | $441,510 | $253,350 | $188,160 |
| 2021 | $12,817 | $441,510 | $253,350 | $188,160 |
| 2020 | $11,449 | $373,780 | $241,290 | $132,490 |
| 2019 | $11,453 | $373,780 | $241,290 | $132,490 |
| 2018 | $11,392 | $373,740 | $241,290 | $132,450 |
| 2017 | $11,392 | $373,740 | $241,290 | $132,450 |
| 2016 | $11,078 | $373,740 | $241,290 | $132,450 |
| 2015 | $11,217 | $384,940 | $250,740 | $134,200 |
| 2014 | $10,917 | $384,940 | $250,740 | $134,200 |
Source: Public Records
Map
Nearby Homes
- 81 Laning St
- 25 South Rd
- 8 Hemlock Rd
- 7 Meadow Rd
- 285 Queen St Unit 4B
- 185 Woodberry Hill Dr
- 273 Queen St Unit 9A
- 138 Butler Ave
- 8 Sycamore Rd
- 110 Rethal St
- 59 Minthal Dr
- 90 Apple Gate Unit 77
- 90 Apple Gate Unit 188
- 90 Apple Gate Unit 186
- 147 Rethal St
- 248 Annelise Ave
- 27 Brookside Dr
- 554 Spring St
- 15 Sunrise Terrace
- 16 Brookside Dr
- 384862 Queen St
- 50 Spring St
- 50 Spring St Unit A & B
- 50 Spring St Unit A
- 50 Spring St Unit B
- 176 Laning St Unit 1
- 176 Laning St
- 176 Laning St
- 206 Laning St
- 196 Laning St
- 200 Laning St
- 218 Laning St
- 234 Laning St
- 4 Chaffee Ln
- 2 Chaffee Ln
- 6 Chaffee Ln
- 4 Stoughton Rd
- 6 Stoughton Rd
- 243 Laning St
- 8 Stoughton Rd