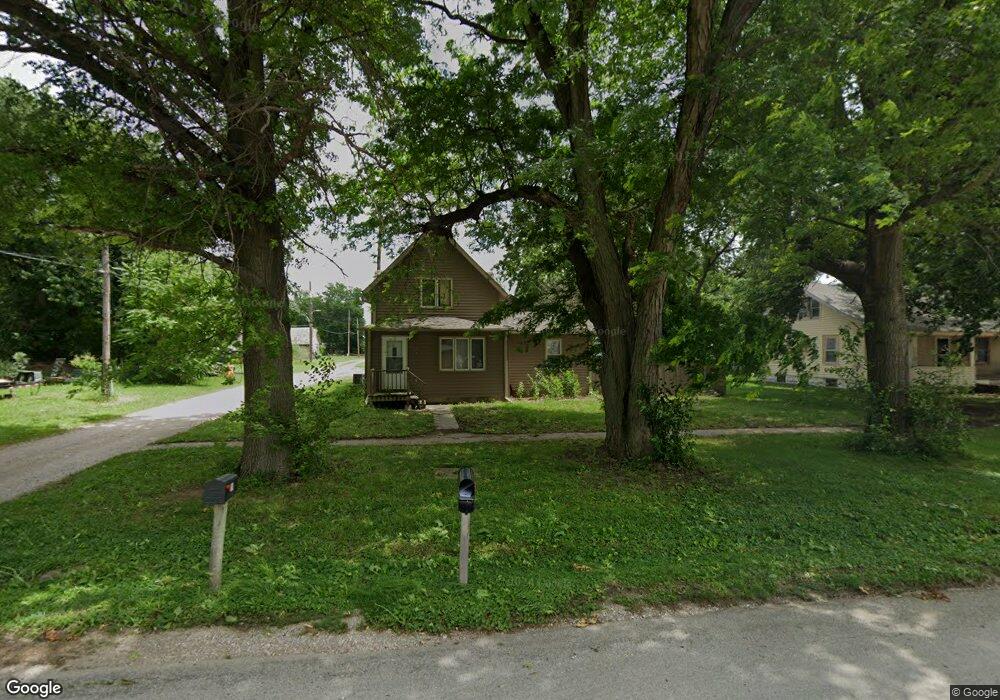
613 S 12th St Tekamah, NE 68061
Estimated Value: $89,000 - $149,000
3
Beds
1
Bath
1,403
Sq Ft
$88/Sq Ft
Est. Value
About This Home
This home is located at 613 S 12th St, Tekamah, NE 68061 and is currently estimated at $123,936, approximately $88 per square foot. 613 S 12th St is a home located in Burt County with nearby schools including High School at Tekamah.
Ownership History
Date
Name
Owned For
Owner Type
Purchase Details
Closed on
Mar 22, 2019
Sold by
Smith Gregory Lee and Smith Michelle
Bought by
Ryley Dominic W
Current Estimated Value
Home Financials for this Owner
Home Financials are based on the most recent Mortgage that was taken out on this home.
Original Mortgage
$41,729
Outstanding Balance
$37,430
Interest Rate
5.75%
Mortgage Type
FHA
Estimated Equity
$86,506
Purchase Details
Closed on
May 12, 2006
Sold by
R K Weatherly And Sons Inc
Bought by
Smith Gregory Lee
Create a Home Valuation Report for This Property
The Home Valuation Report is an in-depth analysis detailing your home's value as well as a comparison with similar homes in the area
Purchase History
| Date | Buyer | Sale Price | Title Company |
|---|---|---|---|
| Ryley Dominic W | $43,000 | Midwest Title Inc | |
| Smith Gregory Lee | $84,000 | None Available |
Source: Public Records
Mortgage History
| Date | Status | Borrower | Loan Amount |
|---|---|---|---|
| Open | Ryley Dominic W | $41,729 |
Source: Public Records
Tax History
| Year | Tax Paid | Tax Assessment Tax Assessment Total Assessment is a certain percentage of the fair market value that is determined by local assessors to be the total taxable value of land and additions on the property. | Land | Improvement |
|---|---|---|---|---|
| 2025 | $909 | $99,358 | $24,150 | $75,208 |
| 2024 | $909 | $76,998 | $22,050 | $54,948 |
| 2023 | $1,079 | $63,477 | $19,425 | $44,052 |
| 2022 | $1,210 | $56,719 | $14,700 | $42,019 |
| 2021 | $1,079 | $57,360 | $9,450 | $47,910 |
| 2020 | $1,023 | $55,563 | $9,450 | $46,113 |
| 2019 | $1,230 | $71,610 | $9,450 | $62,160 |
| 2018 | $1,250 | $71,610 | $9,450 | $62,160 |
| 2017 | $1,242 | $65,555 | $9,555 | $56,000 |
| 2015 | $1,226 | $62,825 | $6,825 | $56,000 |
| 2013 | $1,563 | $72,730 | $6,825 | $65,905 |
Source: Public Records
Map
Nearby Homes
Your Personal Tour Guide
Ask me questions while you tour the home.