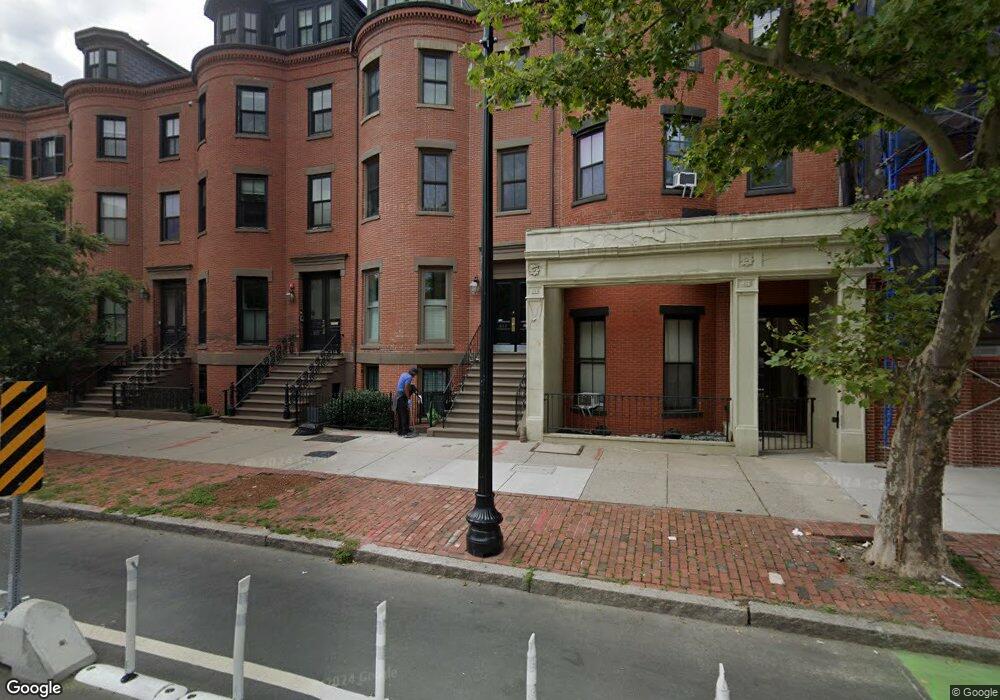
613 Tremont St Unit 1 Boston, MA 02118
South End NeighborhoodEstimated Value: $2,094,000 - $2,378,000
2
Beds
2
Baths
2,000
Sq Ft
$1,097/Sq Ft
Est. Value
About This Home
This home is located at 613 Tremont St Unit 1, Boston, MA 02118 and is currently estimated at $2,194,883, approximately $1,097 per square foot. 613 Tremont St Unit 1 is a home located in Suffolk County with nearby schools including Kingsley Montessori School and Cathedral High School.
Ownership History
Date
Name
Owned For
Owner Type
Purchase Details
Closed on
Jul 11, 2024
Sold by
Rosenberg Mitchell A and Halpern Belle L
Bought by
Belle Linda Halpern T and Belle Halpern
Current Estimated Value
Purchase Details
Closed on
Jun 2, 1995
Sold by
Stowe James B and Stowe Barbara G
Bought by
Rosenberg Mitchell A and Halpern Belle L
Home Financials for this Owner
Home Financials are based on the most recent Mortgage that was taken out on this home.
Original Mortgage
$188,800
Interest Rate
8.2%
Mortgage Type
Purchase Money Mortgage
Purchase Details
Closed on
May 5, 1987
Sold by
Alberts Leonard H
Bought by
Stowe James B
Home Financials for this Owner
Home Financials are based on the most recent Mortgage that was taken out on this home.
Original Mortgage
$160,000
Interest Rate
8.99%
Mortgage Type
Purchase Money Mortgage
Create a Home Valuation Report for This Property
The Home Valuation Report is an in-depth analysis detailing your home's value as well as a comparison with similar homes in the area
Home Values in the Area
Average Home Value in this Area
Purchase History
| Date | Buyer | Sale Price | Title Company |
|---|---|---|---|
| Belle Linda Halpern T | -- | None Available | |
| Belle Linda Halpern T | -- | None Available | |
| Rosenberg Mitchell A | $236,000 | -- | |
| Rosenberg Mitchell A | $236,000 | -- | |
| Stowe James B | $260,000 | -- |
Source: Public Records
Mortgage History
| Date | Status | Borrower | Loan Amount |
|---|---|---|---|
| Previous Owner | Stowe James B | $188,800 | |
| Previous Owner | Stowe James B | $160,000 |
Source: Public Records
Tax History Compared to Growth
Tax History
| Year | Tax Paid | Tax Assessment Tax Assessment Total Assessment is a certain percentage of the fair market value that is determined by local assessors to be the total taxable value of land and additions on the property. | Land | Improvement |
|---|---|---|---|---|
| 2025 | $22,345 | $1,929,600 | $0 | $1,929,600 |
| 2024 | $20,228 | $1,855,800 | $0 | $1,855,800 |
| 2023 | $19,342 | $1,800,900 | $0 | $1,800,900 |
| 2022 | $18,661 | $1,715,200 | $0 | $1,715,200 |
| 2021 | $18,301 | $1,715,200 | $0 | $1,715,200 |
| 2020 | $18,127 | $1,716,600 | $0 | $1,716,600 |
| 2019 | $16,898 | $1,603,200 | $0 | $1,603,200 |
| 2018 | $15,852 | $1,512,600 | $0 | $1,512,600 |
| 2017 | $15,117 | $1,427,500 | $0 | $1,427,500 |
| 2016 | $15,099 | $1,372,600 | $0 | $1,372,600 |
| 2015 | $15,161 | $1,251,900 | $0 | $1,251,900 |
| 2014 | $14,453 | $1,148,900 | $0 | $1,148,900 |
Source: Public Records
Map
Nearby Homes
- 596 Tremont St Unit 2
- 36 Upton St Unit 3
- 30 Dartmouth St Unit 3
- 641 Tremont St Unit 3
- 37 Union Park Unit 2
- 377 Shawmut Ave
- 379 Shawmut Ave
- 2 Clarendon St Unit 401
- 2 Clarendon St Unit 606
- 94 Waltham St Unit 3
- 90 Waltham St Unit 2
- 667 Tremont St Unit 4
- 667 Tremont St Unit 3
- 667 Tremont St Unit 2
- 85 Pembroke St Unit 1
- 87 Pembroke St
- 320 Shawmut Ave Unit 4
- 6 Dartmouth Place Unit 6
- 6 Dartmouth Place
- 81 Waltham St Unit 6
- 613 Tremont St Unit 4
- 613 Tremont St Unit 3
- 613 Tremont St Unit 2
- 613 Tremont St Unit B-1
- 611 Tremont St Unit 2
- 611 Tremont St Unit 4
- 611 Tremont St Unit 611A
- 611 Tremont St Unit 3
- 615 Tremont St Unit 2
- 615 Tremont St Unit 1
- 617 Tremont St Unit 4
- 617 Tremont St Unit 3
- 617 Tremont St Unit 2
- 617 Tremont St Unit 1
- 617 Tremont St Unit 1,617
- 617 Tremont St Unit 9
- 609 Tremont St Unit 4
- 609 Tremont St Unit 3
- 609 Tremont St Unit 1
- 6 Dartmouth St Unit 4