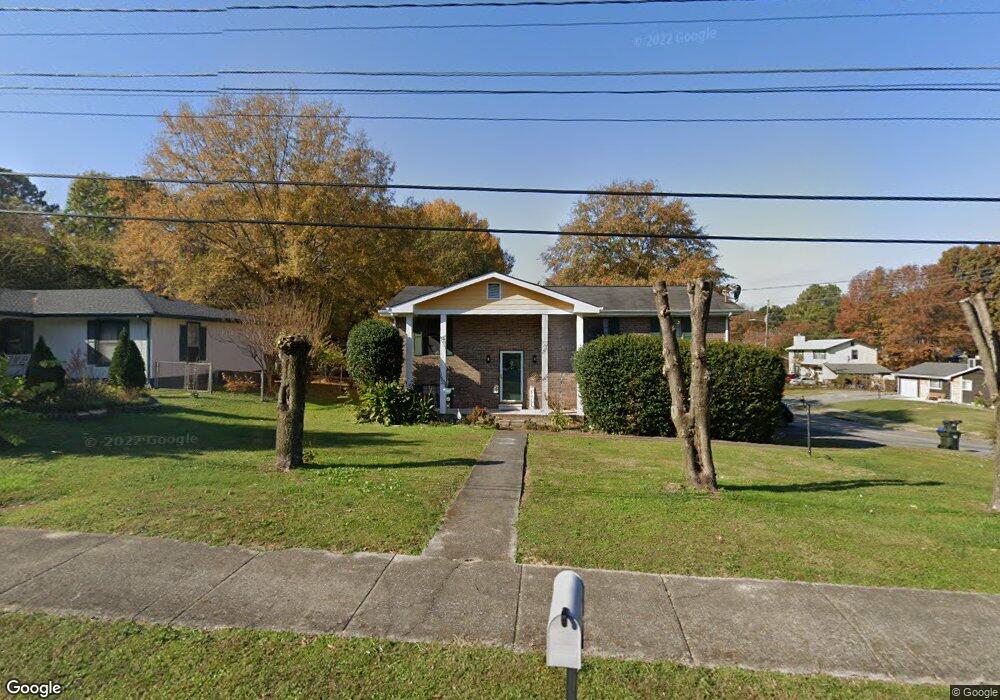
613 W Boundary St Dalton, GA 30720
Estimated Value: $224,471 - $268,000
3
Beds
2
Baths
1,500
Sq Ft
$161/Sq Ft
Est. Value
About This Home
This home is located at 613 W Boundary St, Dalton, GA 30720 and is currently estimated at $241,868, approximately $161 per square foot. 613 W Boundary St is a home located in Whitfield County with nearby schools including Westwood Elementary School, Dalton Middle School, and Dalton High School.
Ownership History
Date
Name
Owned For
Owner Type
Purchase Details
Closed on
Sep 25, 2009
Sold by
Us Bank Na
Bought by
Orellana Janett M
Current Estimated Value
Home Financials for this Owner
Home Financials are based on the most recent Mortgage that was taken out on this home.
Original Mortgage
$95,243
Outstanding Balance
$62,256
Interest Rate
5.1%
Mortgage Type
FHA
Estimated Equity
$179,612
Purchase Details
Closed on
Sep 1, 2009
Sold by
Stanfield Terry L
Bought by
Us Bank Na
Home Financials for this Owner
Home Financials are based on the most recent Mortgage that was taken out on this home.
Original Mortgage
$95,243
Outstanding Balance
$62,256
Interest Rate
5.1%
Mortgage Type
FHA
Estimated Equity
$179,612
Purchase Details
Closed on
Apr 7, 2009
Sold by
Stanfield Terry L
Bought by
Us Bank Na
Purchase Details
Closed on
Apr 26, 2001
Sold by
Stanfield Terry L
Bought by
Stanfield Terry L and Stanfield Virginia L
Purchase Details
Closed on
Nov 1, 1993
Bought by
Stanfield Terry L
Create a Home Valuation Report for This Property
The Home Valuation Report is an in-depth analysis detailing your home's value as well as a comparison with similar homes in the area
Home Values in the Area
Average Home Value in this Area
Purchase History
| Date | Buyer | Sale Price | Title Company |
|---|---|---|---|
| Orellana Janett M | $97,000 | -- | |
| Us Bank Na | $90,210 | -- | |
| Us Bank Na | $99,045 | -- | |
| Stanfield Terry L | -- | -- | |
| Stanfield Terry L | $72,000 | -- |
Source: Public Records
Mortgage History
| Date | Status | Borrower | Loan Amount |
|---|---|---|---|
| Open | Us Bank Na | $95,243 |
Source: Public Records
Tax History Compared to Growth
Tax History
| Year | Tax Paid | Tax Assessment Tax Assessment Total Assessment is a certain percentage of the fair market value that is determined by local assessors to be the total taxable value of land and additions on the property. | Land | Improvement |
|---|---|---|---|---|
| 2024 | $1,855 | $88,240 | $8,000 | $80,240 |
| 2023 | $1,855 | $56,322 | $8,100 | $48,222 |
| 2022 | $1,343 | $46,398 | $5,670 | $40,728 |
| 2021 | $1,346 | $46,398 | $5,670 | $40,728 |
| 2020 | $1,386 | $46,398 | $5,670 | $40,728 |
| 2019 | $1,425 | $46,398 | $5,670 | $40,728 |
| 2018 | $1,371 | $44,546 | $5,670 | $38,876 |
| 2017 | $1,314 | $44,546 | $5,670 | $38,876 |
| 2016 | $1,130 | $39,327 | $3,969 | $35,358 |
| 2014 | $1,007 | $37,455 | $3,780 | $33,675 |
| 2013 | -- | $37,454 | $3,780 | $33,674 |
Source: Public Records
Map
Nearby Homes
- 611 W Boundary St
- 900 W Tyler St
- 900 W Tyler St
- 903 W Tyler St
- 616 W Boundary St
- 609 W Boundary St
- 902 W Tyler St
- 805 W Tyler St
- 614 W Boundary St
- 905 W Tyler St
- 703 W Boundary St
- 607 W Boundary St
- 705 W Boundary St
- 610 W Boundary St
- 610 W Boundary St
- 801 W Tyler St
- 910 Clark St
- 906 W Tyler St
- 605 W Boundary St
- 901 Johnson Ct