613 W Gage St Forest, OH 45843
Estimated Value: $174,000 - $259,000
4
Beds
3
Baths
2,180
Sq Ft
$96/Sq Ft
Est. Value
About This Home
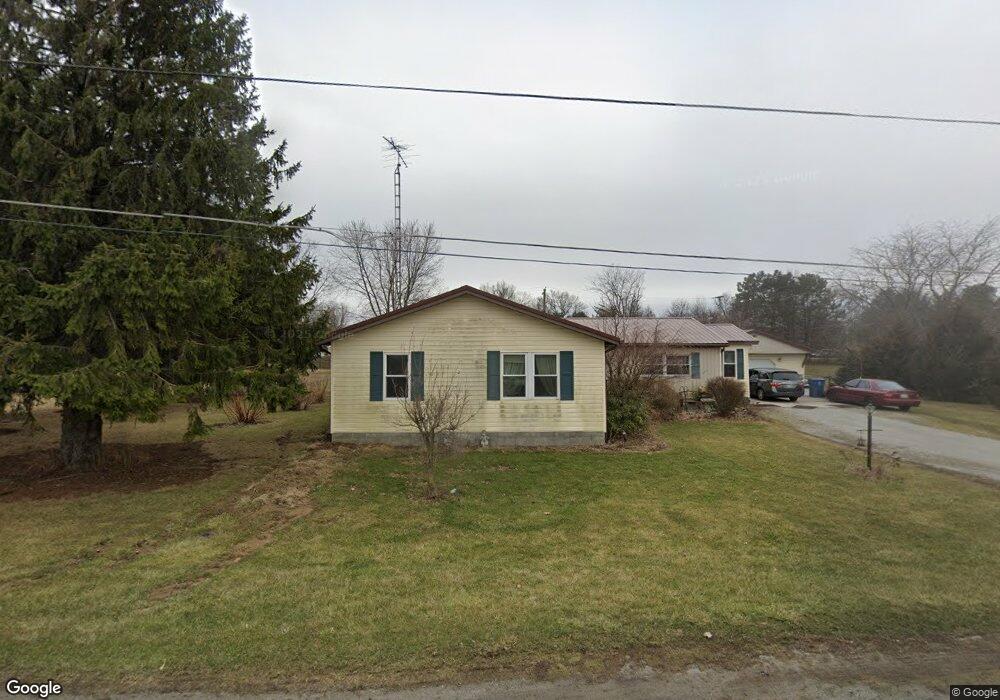
This home is located at 613 W Gage St, Forest, OH 45843 and is currently estimated at $209,046, approximately $95 per square foot. 613 W Gage St is a home located in Hardin County with nearby schools including Riverdale Middle School and Riverdale High School.
Ownership History
Date
Name
Owned For
Owner Type
Purchase Details
Closed on
Mar 12, 2026
Sold by
Salty Dog Investments Llc
Bought by
Marvin Samantha
Current Estimated Value
Purchase Details
Closed on
Oct 21, 2019
Sold by
Hicks James I and Hicks Kathy F
Bought by
Bushong Douglas
Home Financials for this Owner
Home Financials are based on the most recent Mortgage that was taken out on this home.
Original Mortgage
$166,250
Interest Rate
3.4%
Mortgage Type
New Conventional
Purchase Details
Closed on
May 3, 2016
Sold by
Sterrett Thomas D and Sterrett Donna R
Bought by
Sterrett Joel D and Sterrett Principal Protection
Purchase Details
Closed on
Dec 18, 2000
Bought by
Hicks James I and Hicks Kathy F
Purchase Details
Closed on
May 20, 1999
Bought by
Flanigan David A and Flanigan Victo
Purchase Details
Closed on
Oct 13, 1995
Bought by
Mowery John W
Purchase Details
Closed on
Aug 15, 1986
Create a Home Valuation Report for This Property
The Home Valuation Report is an in-depth analysis detailing your home's value as well as a comparison with similar homes in the area
Purchase History
| Date | Buyer | Sale Price | Title Company |
|---|---|---|---|
| Marvin Samantha | $187,000 | None Listed On Document | |
| Bushong Douglas | $175,000 | None Available | |
| Sterrett Joel D | -- | None Available | |
| Hicks James I | $102,500 | -- | |
| Flanigan David A | $115,000 | -- | |
| Mowery John W | -- | -- | |
| -- | $4,700 | -- |
Source: Public Records
Mortgage History
| Date | Status | Borrower | Loan Amount |
|---|---|---|---|
| Previous Owner | Bushong Douglas | $166,250 |
Source: Public Records
Tax History
| Year | Tax Paid | Tax Assessment Tax Assessment Total Assessment is a certain percentage of the fair market value that is determined by local assessors to be the total taxable value of land and additions on the property. | Land | Improvement |
|---|---|---|---|---|
| 2025 | $1,562 | $49,240 | $4,780 | $44,460 |
| 2024 | $1,562 | $49,240 | $4,780 | $44,460 |
| 2023 | $1,603 | $49,240 | $4,780 | $44,460 |
| 2022 | $1,432 | $38,540 | $4,410 | $34,130 |
| 2021 | $1,552 | $38,540 | $4,410 | $34,130 |
| 2020 | $1,556 | $38,540 | $4,410 | $34,130 |
| 2019 | $1,233 | $31,100 | $4,200 | $26,900 |
| 2018 | $1,181 | $31,100 | $4,200 | $26,900 |
| 2017 | $598 | $31,100 | $4,200 | $26,900 |
| 2016 | $1,290 | $34,180 | $4,880 | $29,300 |
| 2015 | $1,210 | $34,180 | $4,880 | $29,300 |
| 2014 | $611 | $34,180 | $4,880 | $29,300 |
| 2013 | $596 | $34,180 | $4,880 | $29,300 |
Source: Public Records
Map
Nearby Homes
- 18660 County Road 20
- 406 Wells Rd
- 317 Smith St
- 0 S Davis St
- 412 S Patterson St
- 0 S Patterson St
- 402 E Lima St
- 0 Cr 215 Unit 11594771
- 0 Cr 215 Unit 25370311
- 0 Cr 215 Unit 11598074
- 3065 County Road 205
- 11270 Township Road 79
- 15047 Ohio 37
- 21426 County Road 17
- 15090 County Road 304
- 19507 County Highway 70
- 5091 County Road 175
- 213 Sandusky St W
- 20453 Township Road 187
- 162 N Main St
Your Personal Tour Guide
Ask me questions while you tour the home.