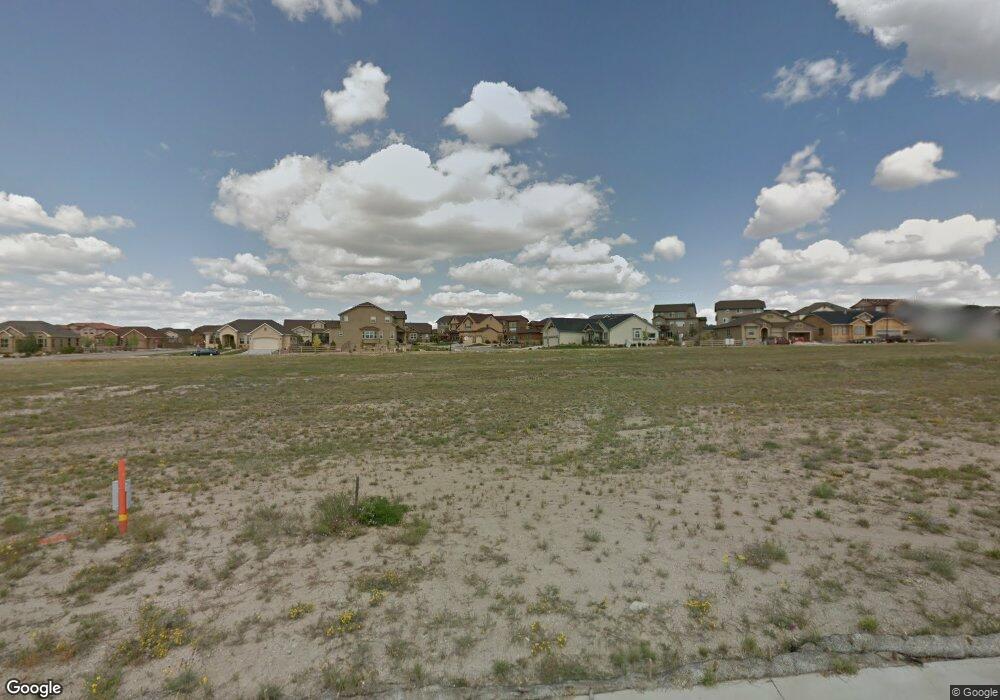
6130 Harney Dr Colorado Springs, CO 80924
Wolf Ranch NeighborhoodEstimated Value: $698,747 - $734,000
5
Beds
4
Baths
3,700
Sq Ft
$193/Sq Ft
Est. Value
About This Home
This home is located at 6130 Harney Dr, Colorado Springs, CO 80924 and is currently estimated at $715,687, approximately $193 per square foot. 6130 Harney Dr is a home located in El Paso County with nearby schools including Legacy Peak Elementary School, Chinook Trail Middle School, and Liberty High School.
Ownership History
Date
Name
Owned For
Owner Type
Purchase Details
Closed on
Sep 7, 2016
Sold by
Underwood Howitt H
Bought by
Harger Christopher R and Harger Shaye A
Current Estimated Value
Home Financials for this Owner
Home Financials are based on the most recent Mortgage that was taken out on this home.
Original Mortgage
$379,905
Outstanding Balance
$303,940
Interest Rate
3.48%
Mortgage Type
New Conventional
Estimated Equity
$411,747
Purchase Details
Closed on
Mar 21, 2014
Sold by
Underwood Howitt H
Bought by
Underwood Ii Howitt H and Underwood Jelena
Purchase Details
Closed on
Nov 15, 2012
Sold by
Elite Properties Of America Inc
Bought by
Underwood Ii Howitt H
Home Financials for this Owner
Home Financials are based on the most recent Mortgage that was taken out on this home.
Original Mortgage
$343,651
Interest Rate
3.43%
Mortgage Type
VA
Purchase Details
Closed on
Jul 13, 2012
Sold by
Dmi #6 Llc
Bought by
Elite Properties Of America Inc
Create a Home Valuation Report for This Property
The Home Valuation Report is an in-depth analysis detailing your home's value as well as a comparison with similar homes in the area
Home Values in the Area
Average Home Value in this Area
Purchase History
| Date | Buyer | Sale Price | Title Company |
|---|---|---|---|
| Harger Christopher R | $399,900 | Empire Title Colorago Spring | |
| Underwood Ii Howitt H | -- | None Available | |
| Underwood Ii Howitt H | $343,651 | Cb Title | |
| Elite Properties Of America Inc | $75,000 | Land Title Guarantee Company |
Source: Public Records
Mortgage History
| Date | Status | Borrower | Loan Amount |
|---|---|---|---|
| Open | Harger Christopher R | $379,905 | |
| Previous Owner | Underwood Ii Howitt H | $343,651 |
Source: Public Records
Tax History Compared to Growth
Tax History
| Year | Tax Paid | Tax Assessment Tax Assessment Total Assessment is a certain percentage of the fair market value that is determined by local assessors to be the total taxable value of land and additions on the property. | Land | Improvement |
|---|---|---|---|---|
| 2025 | $4,791 | $48,950 | -- | -- |
| 2024 | $4,772 | $46,490 | $8,040 | $38,450 |
| 2022 | $3,803 | $33,960 | $7,390 | $26,570 |
| 2021 | $4,052 | $34,930 | $7,600 | $27,330 |
| 2020 | $3,965 | $32,460 | $6,610 | $25,850 |
| 2019 | $3,939 | $32,460 | $6,610 | $25,850 |
| 2018 | $3,578 | $29,190 | $5,880 | $23,310 |
| 2017 | $3,571 | $29,190 | $5,880 | $23,310 |
| 2016 | $3,540 | $29,930 | $6,400 | $23,530 |
| 2015 | $3,537 | $29,930 | $6,400 | $23,530 |
| 2014 | $3,439 | $29,050 | $6,110 | $22,940 |
Source: Public Records
Map
Nearby Homes
- 9267 Penobscot Ct
- 9190 Kathi Creek Dr
- 6153 Leon Young Dr
- 6050 Traditions Dr
- 9256 Penobscot Ct
- 5998 Rowdy Dr
- 5970 Traditions Dr
- 9767 Wolf Lake Dr
- 5864 Yancey Dr
- 6093 Rowdy Dr
- 5859 Leon Young Dr
- 5817 Leon Young Dr
- 6516 Cubbage Dr
- 6580 Cubbage Dr
- 6229 Cubbage Dr
- 5747 Leon Young Dr
- 9587 Carcassonne Place
- 9567 Carcassonne Place
- 9557 Carcassonne Place
- 9607 Carcassonne Place
- 6116 Harney Dr
- 6144 Harney Dr
- 6102 Harney Dr
- 6158 Harney Dr
- 6143 Adamants Dr
- 6131 Harney Dr
- 6119 Adamants Dr
- 6117 Harney Dr
- 6167 Adamants Dr
- 6145 Harney Dr
- 6159 Harney Dr
- 6103 Harney Dr
- 6191 Adamants Dr
- 6172 Harney Dr
- 6173 Harney Dr
- 6203 Adamants Dr
- 6186 Harney Dr
- 6088 Harney Dr
- 6122 Wolf Village Dr
- 6114 Wolf Village Dr