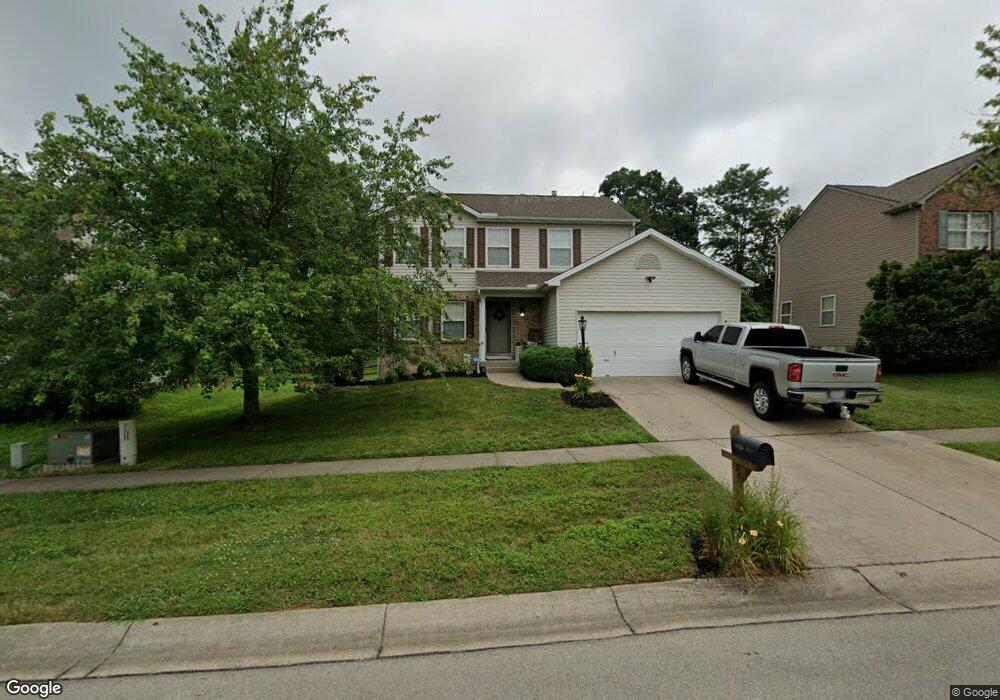
6131 Maple Grove Morrow, OH 45152
Estimated Value: $361,000 - $387,000
4
Beds
3
Baths
2,272
Sq Ft
$164/Sq Ft
Est. Value
About This Home
This home is located at 6131 Maple Grove, Morrow, OH 45152 and is currently estimated at $372,102, approximately $163 per square foot. 6131 Maple Grove is a home located in Warren County with nearby schools including Little Miami Early Childhood Center, Little Miami Intermediate Middle School, and Little Miami Middle School.
Ownership History
Date
Name
Owned For
Owner Type
Purchase Details
Closed on
Sep 11, 2009
Sold by
Hoeppner Sheila H and Hoeppner Kenneth D
Bought by
Ruth Brandon R and Essert Courtney A
Current Estimated Value
Purchase Details
Closed on
Jan 2, 2004
Sold by
Reed Michael A and Reed Sheila H
Bought by
Reed Sheila H
Purchase Details
Closed on
Sep 12, 2002
Sold by
Rhone Inc
Bought by
Reed Sheila H and Reed Michael A
Home Financials for this Owner
Home Financials are based on the most recent Mortgage that was taken out on this home.
Original Mortgage
$155,540
Interest Rate
6.54%
Mortgage Type
New Conventional
Purchase Details
Closed on
Sep 14, 2001
Sold by
Ryland Group
Bought by
Rhone Inc
Purchase Details
Closed on
Jul 31, 2000
Sold by
Towne Dev Group
Bought by
Ryland Group Inc
Create a Home Valuation Report for This Property
The Home Valuation Report is an in-depth analysis detailing your home's value as well as a comparison with similar homes in the area
Home Values in the Area
Average Home Value in this Area
Purchase History
| Date | Buyer | Sale Price | Title Company |
|---|---|---|---|
| Ruth Brandon R | $181,000 | Lawyers Title | |
| Reed Sheila H | -- | -- | |
| Reed Sheila H | $174,540 | -- | |
| Rhone Inc | $154,850 | -- | |
| Ryland Group Inc | $29,500 | -- |
Source: Public Records
Mortgage History
| Date | Status | Borrower | Loan Amount |
|---|---|---|---|
| Previous Owner | Reed Sheila H | $155,540 |
Source: Public Records
Tax History
| Year | Tax Paid | Tax Assessment Tax Assessment Total Assessment is a certain percentage of the fair market value that is determined by local assessors to be the total taxable value of land and additions on the property. | Land | Improvement |
|---|---|---|---|---|
| 2025 | $4,634 | $104,510 | $28,000 | $76,510 |
| 2024 | $4,634 | $104,510 | $28,000 | $76,510 |
| 2023 | $4,007 | $80,647 | $12,915 | $67,732 |
| 2022 | $3,961 | $80,647 | $12,915 | $67,732 |
| 2021 | $3,776 | $80,647 | $12,915 | $67,732 |
| 2020 | $3,596 | $65,566 | $10,500 | $55,066 |
| 2019 | $3,656 | $65,566 | $10,500 | $55,066 |
| 2018 | $3,572 | $65,566 | $10,500 | $55,066 |
| 2017 | $2,946 | $54,215 | $9,177 | $45,038 |
| 2016 | $3,017 | $54,215 | $9,177 | $45,038 |
| 2015 | $3,016 | $54,215 | $9,177 | $45,038 |
| 2014 | $3,414 | $54,220 | $9,180 | $45,040 |
| 2013 | $3,348 | $62,030 | $10,500 | $51,530 |
Source: Public Records
Map
Nearby Homes
- 668 Thornton Dr
- 704 Oak Forest Dr
- 723 Grande Oaks Dr
- 616 Crabapple Ct
- 5805 Turning Leaf Way
- 873 E US Highway 22 and 3
- 873 U S 22
- 6046 Driftwood Ct
- 6250 Avebury Ct
- 5705 Pepperridge Ct
- 477 Auburn Grove Dr
- 553 Auburn Grove Dr
- 5548 Castle Dr
- 5172 Williams Ridge Dr
- 920 Pondside Ln
- 122 Deere Run Ln
- 415 Forest Edge Dr
- 120 Ridgeview Ln
- 1327 Chelsea Ct
- 0 Deere Run Ln Unit 1836428
- 6119 Maple Grove
- 6105 Maple Grove
- 6155 Maple Grove
- 6093 Maple Grove
- 6169 Maple Grove
- 635 Thornton Dr
- 647 Thornton Dr
- 586 Linden Creek
- 6181 Maple Grove
- 657 Thornton Dr
- 563 E Us Highway 22 and 3
- 598 Linden Creek
- 6193 Maple Grove
- 667 Thornton Dr
- 636 Thornton Dr
- 610 Linden Creek
- 6205 Maple Grove
- 535 Us Rt 22 & 3
- 535 St Rt 22 & 3
- 535 U S 22
Your Personal Tour Guide
Ask me questions while you tour the home.