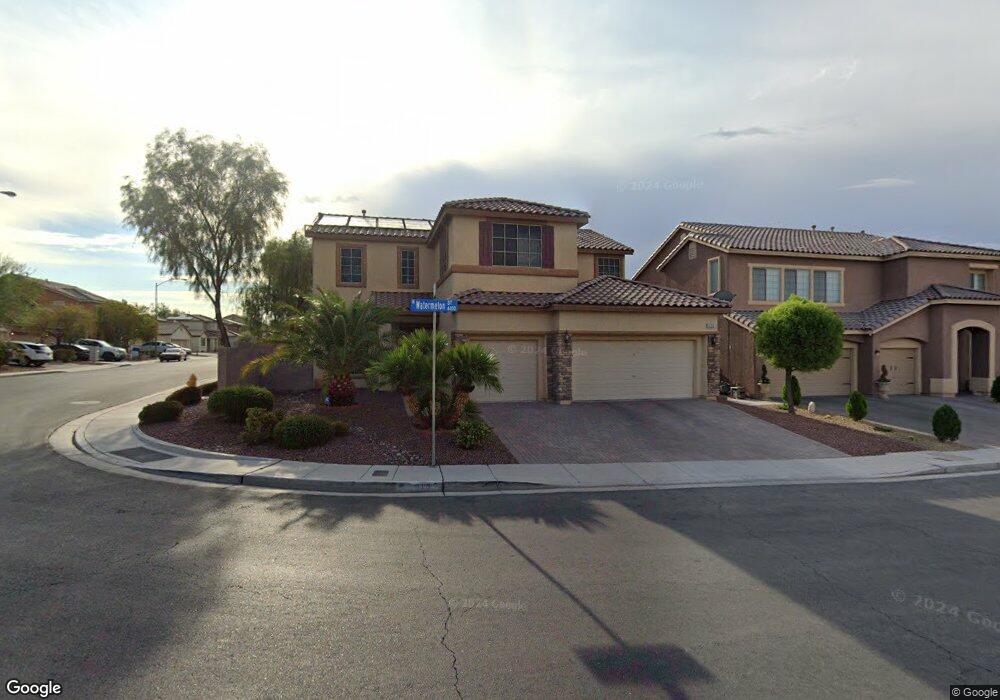
6132 Watermelon St North Las Vegas, NV 89081
Northridge NeighborhoodEstimated Value: $531,000 - $560,827
4
Beds
3
Baths
3,131
Sq Ft
$175/Sq Ft
Est. Value
About This Home
This home is located at 6132 Watermelon St, North Las Vegas, NV 89081 and is currently estimated at $547,207, approximately $174 per square foot. 6132 Watermelon St is a home located in Clark County with nearby schools including D.L. Dusty Dickens Elementary School, Carroll M. Johnston STEM Academy of Environmental Studies, and Clifford O. Findlay Middle School.
Ownership History
Date
Name
Owned For
Owner Type
Purchase Details
Closed on
Jun 29, 2009
Sold by
Hsbc Bank Usa National Association
Bought by
Hughes James William and Hughes Debra Jean
Current Estimated Value
Home Financials for this Owner
Home Financials are based on the most recent Mortgage that was taken out on this home.
Original Mortgage
$150,400
Outstanding Balance
$98,161
Interest Rate
5.31%
Mortgage Type
Unknown
Estimated Equity
$449,046
Purchase Details
Closed on
May 15, 2009
Sold by
Gray Justin M
Bought by
Hsbc Bank Usa National Association
Home Financials for this Owner
Home Financials are based on the most recent Mortgage that was taken out on this home.
Original Mortgage
$150,400
Outstanding Balance
$98,161
Interest Rate
5.31%
Mortgage Type
Unknown
Estimated Equity
$449,046
Purchase Details
Closed on
Nov 28, 2005
Sold by
Greystone Nevada Llc
Bought by
Gray Justin M
Home Financials for this Owner
Home Financials are based on the most recent Mortgage that was taken out on this home.
Original Mortgage
$340,850
Interest Rate
6.37%
Mortgage Type
Unknown
Purchase Details
Closed on
Aug 29, 2005
Sold by
Us Home Corp
Bought by
Greystone Nevada Llc
Create a Home Valuation Report for This Property
The Home Valuation Report is an in-depth analysis detailing your home's value as well as a comparison with similar homes in the area
Home Values in the Area
Average Home Value in this Area
Purchase History
| Date | Buyer | Sale Price | Title Company |
|---|---|---|---|
| Hughes James William | $188,000 | Chicago Title Las Vegas | |
| Hsbc Bank Usa National Association | $223,000 | Fidelity National Default So | |
| Gray Justin M | $426,108 | North American Title Company | |
| Greystone Nevada Llc | -- | North American Title Co |
Source: Public Records
Mortgage History
| Date | Status | Borrower | Loan Amount |
|---|---|---|---|
| Open | Hughes James William | $150,400 | |
| Previous Owner | Gray Justin M | $340,850 |
Source: Public Records
Tax History Compared to Growth
Tax History
| Year | Tax Paid | Tax Assessment Tax Assessment Total Assessment is a certain percentage of the fair market value that is determined by local assessors to be the total taxable value of land and additions on the property. | Land | Improvement |
|---|---|---|---|---|
| 2025 | $3,348 | $180,230 | $38,150 | $142,080 |
| 2024 | $3,101 | $180,230 | $38,150 | $142,080 |
| 2023 | $3,101 | $171,677 | $37,800 | $133,877 |
| 2022 | $2,872 | $136,850 | $30,800 | $106,050 |
| 2021 | $2,659 | $130,528 | $28,700 | $101,828 |
| 2020 | $2,466 | $122,076 | $25,900 | $96,176 |
| 2019 | $2,311 | $115,675 | $24,500 | $91,175 |
| 2018 | $2,205 | $102,506 | $19,600 | $82,906 |
| 2017 | $3,149 | $93,884 | $17,500 | $76,384 |
| 2016 | $2,065 | $83,485 | $14,000 | $69,485 |
| 2015 | $2,060 | $74,625 | $10,500 | $64,125 |
| 2014 | $1,996 | $57,740 | $8,400 | $49,340 |
Source: Public Records
Map
Nearby Homes
- 3844 Hollycroft Dr
- 4016 Gaster Ave
- 3913 Pepper Thorn Ave Unit 201
- 4017 Kristina Lynn Ave
- 3760 E Carisbrook Dr
- 3760 Hollycroft Dr
- 6312 Beige Bluff St Unit 102
- 6079 Salsbury Cove Dr
- 6247 Fort Worth St Unit 1
- 6316 Beige Bluff St Unit 201
- 4021 Pepper Thorn Ave Unit 102
- 5941 Galway Bay St
- 6329 Blowing Sky St Unit 201
- 6009 La Coste St
- 6313 Snap Ridge St Unit 201
- 3920 Smokey Fog Ave Unit 201
- 3720 Gallowtree Ave
- 6021 Vivanco St
- 4116 Cloudy Night Ave
- 4112 Carol Bailey Ave
- 6128 Watermelon St
- 6133 Kami St
- 6124 Watermelon St
- 6129 Kami St
- 3928 Recktenwall Ave
- 3932 Recktenwall Ave
- 6129 Watermelon St
- 6133 Watermelon St
- 6125 Kami St
- 3924 Recktenwall Ave
- 6120 Watermelon St
- 6125 Watermelon St
- 3936 Recktenwall Ave
- 6137 Watermelon St Unit 1
- 6121 Kami St
- 6121 Watermelon St
- 3940 Recktenwall Ave
- 6116 Watermelon St
- 6128 Kami St
- 6117 Kami St