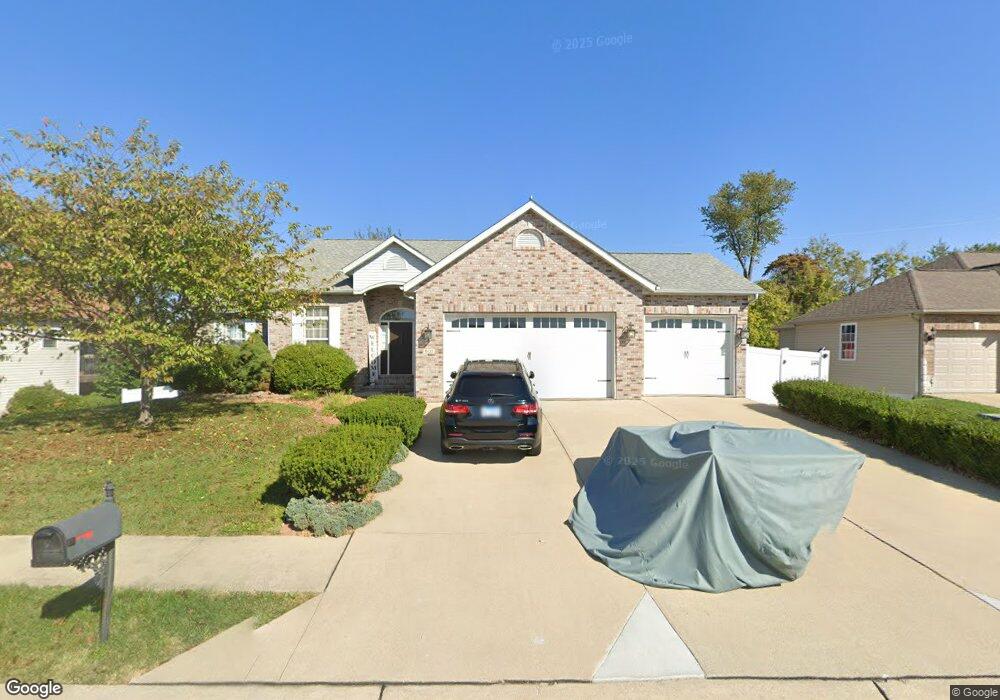
6133 Keebler Oaks Dr Maryville, IL 62062
Estimated Value: $332,417 - $445,000
3
Beds
2
Baths
1,732
Sq Ft
$228/Sq Ft
Est. Value
About This Home
This home is located at 6133 Keebler Oaks Dr, Maryville, IL 62062 and is currently estimated at $395,104, approximately $228 per square foot. 6133 Keebler Oaks Dr is a home located in Madison County with nearby schools including Maryville Elementary School, Dorris Intermediate School, and Collinsville Middle School.
Ownership History
Date
Name
Owned For
Owner Type
Purchase Details
Closed on
May 12, 2023
Sold by
Yassir Darine
Bought by
Mh Trust
Current Estimated Value
Purchase Details
Closed on
Oct 3, 2005
Sold by
Marmon Builders Inc
Bought by
Yassir Darine
Home Financials for this Owner
Home Financials are based on the most recent Mortgage that was taken out on this home.
Original Mortgage
$217,360
Interest Rate
7.5%
Mortgage Type
Fannie Mae Freddie Mac
Purchase Details
Closed on
Mar 25, 2004
Sold by
Osborn Donald P and Osborn Joseph E
Bought by
Marmon Builders Inc
Home Financials for this Owner
Home Financials are based on the most recent Mortgage that was taken out on this home.
Original Mortgage
$205,000
Interest Rate
6.37%
Mortgage Type
Unknown
Create a Home Valuation Report for This Property
The Home Valuation Report is an in-depth analysis detailing your home's value as well as a comparison with similar homes in the area
Home Values in the Area
Average Home Value in this Area
Purchase History
| Date | Buyer | Sale Price | Title Company |
|---|---|---|---|
| Mh Trust | -- | Town & Country Title | |
| Yassir Darine | $272,000 | -- | |
| Marmon Builders Inc | $45,000 | Abstracts & Titles Inc |
Source: Public Records
Mortgage History
| Date | Status | Borrower | Loan Amount |
|---|---|---|---|
| Previous Owner | Yassir Darine | $217,360 | |
| Previous Owner | Marmon Builders Inc | $205,000 | |
| Closed | Marmon Builders Inc | $43,900 |
Source: Public Records
Tax History Compared to Growth
Tax History
| Year | Tax Paid | Tax Assessment Tax Assessment Total Assessment is a certain percentage of the fair market value that is determined by local assessors to be the total taxable value of land and additions on the property. | Land | Improvement |
|---|---|---|---|---|
| 2024 | $7,332 | $117,990 | $23,780 | $94,210 |
| 2023 | $7,332 | $109,210 | $22,010 | $87,200 |
| 2022 | $6,889 | $100,990 | $20,350 | $80,640 |
| 2021 | $6,186 | $94,880 | $19,120 | $75,760 |
| 2020 | $5,593 | $85,350 | $17,170 | $68,180 |
| 2019 | $5,428 | $82,430 | $16,580 | $65,850 |
| 2018 | $5,291 | $78,090 | $15,710 | $62,380 |
| 2017 | $5,177 | $76,540 | $15,400 | $61,140 |
| 2016 | $5,266 | $76,540 | $15,400 | $61,140 |
| 2015 | $6,105 | $74,550 | $15,000 | $59,550 |
| 2014 | $6,105 | $89,500 | $17,960 | $71,540 |
| 2013 | $6,105 | $89,500 | $17,960 | $71,540 |
Source: Public Records
Map
Nearby Homes
- 6020 Keebler Oaks Dr
- 22 Oak Valley Dr
- 54 Oak Leaf Dr
- 104 Summit Ridge Unit 104
- 912 Oakridge Dr
- 2723 Keebler Rd
- 1029 Andra Dr
- 1014 Daniel Dr
- 2704 Stone Valley Dr
- 1005 Daniel Dr
- 2790 Deerfield Dr
- 2708 Fieldstone Dr
- 5 Deer Trail Dr
- 625 W Country Ln
- 19 Chelsea Rd
- 501 Drost St
- 58 Stonebridge Crossing Dr
- 54 Stonebridge Crossing Dr
- 50 Stonebridge Crossing Dr
- 137 W Zupan St
- 6137 Keebler Oaks Dr
- 6129 Keebler Oaks Dr
- 6141 Keebler Oaks Dr
- 6125 Keebler Oaks Dr
- 6136 Keebler Oaks Dr
- 6140 Keebler Oaks Dr
- 6132 Keebler Oaks Dr
- 6144 Keebler Oaks Dr
- 6145 Keebler Oaks Dr
- 1603 Pleasant Ridge Rd
- 6128 Keebler Oaks Dr
- 6121 Keebler Oaks Dr
- 6124 Keebler Oaks Dr
- 177 Oak Hill Dr
- 6149 Keebler Oaks Dr
- 149 Oak Hill Dr
- 6117 Keebler Oaks Dr
- 153 Oak Hill Dr
- 173 Oak Hill Dr
- 6120 Keebler Oaks Dr