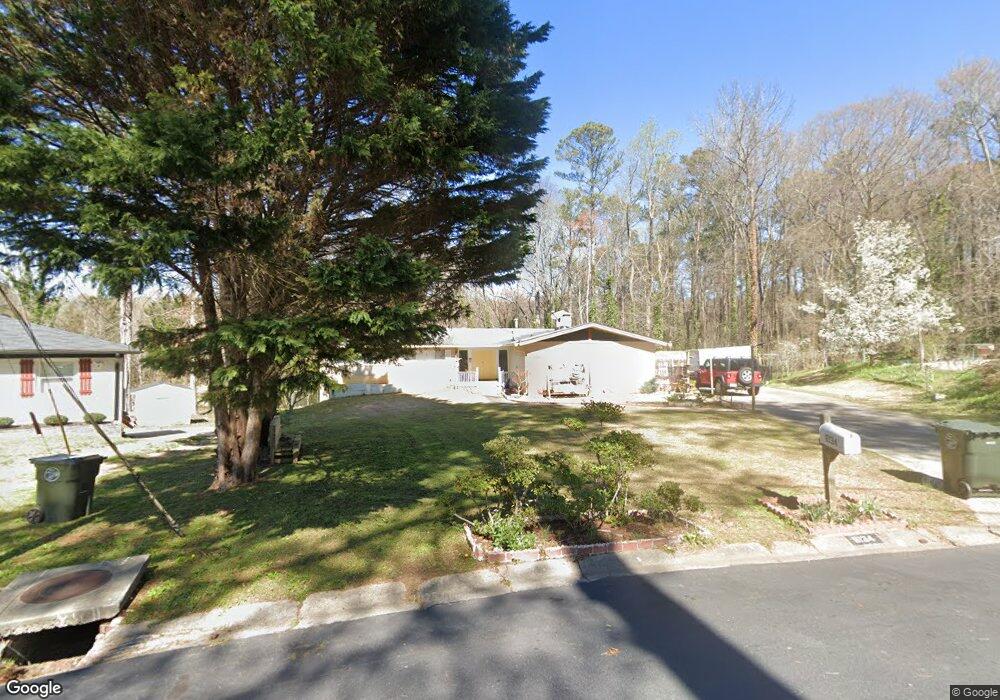
6134 Graceland Cir Morrow, GA 30260
Estimated Value: $258,568 - $299,000
3
Beds
2
Baths
1,587
Sq Ft
$175/Sq Ft
Est. Value
About This Home
This home is located at 6134 Graceland Cir, Morrow, GA 30260 and is currently estimated at $277,892, approximately $175 per square foot. 6134 Graceland Cir is a home located in Clayton County with nearby schools including Morrow Elementary School, Babb Middle School, and Forest Park High School.
Ownership History
Date
Name
Owned For
Owner Type
Purchase Details
Closed on
Nov 1, 2024
Sold by
Huynh Nhan T
Bought by
Huynh Kim Dung T
Current Estimated Value
Purchase Details
Closed on
Nov 2, 2021
Sold by
Huynh Nhan T
Bought by
Huynh Nhan T and Huynh Kim Dung
Purchase Details
Closed on
May 27, 2011
Sold by
Pham Thomas D
Bought by
Huynh Nhan T
Home Financials for this Owner
Home Financials are based on the most recent Mortgage that was taken out on this home.
Original Mortgage
$45,600
Interest Rate
4.79%
Mortgage Type
New Conventional
Purchase Details
Closed on
Apr 30, 2010
Sold by
Hud-Housing Of Urban Dev
Bought by
Pham Thomase D
Purchase Details
Closed on
May 5, 2009
Sold by
Bailey Kenneth R and Bailey Betty M
Bought by
Wells Fargo Bank Na
Purchase Details
Closed on
Mar 3, 2009
Sold by
Wells Fargo Bank Na
Bought by
Hud-Housing Of Urban Dev
Create a Home Valuation Report for This Property
The Home Valuation Report is an in-depth analysis detailing your home's value as well as a comparison with similar homes in the area
Home Values in the Area
Average Home Value in this Area
Purchase History
| Date | Buyer | Sale Price | Title Company |
|---|---|---|---|
| Huynh Kim Dung T | -- | -- | |
| Huynh Nhan T | -- | -- | |
| Huynh Nhan T | $57,000 | -- | |
| Pham Thomase D | -- | -- | |
| Wells Fargo Bank Na | $148,773 | -- | |
| Hud-Housing Of Urban Dev | -- | -- |
Source: Public Records
Mortgage History
| Date | Status | Borrower | Loan Amount |
|---|---|---|---|
| Previous Owner | Huynh Nhan T | $45,600 |
Source: Public Records
Tax History Compared to Growth
Tax History
| Year | Tax Paid | Tax Assessment Tax Assessment Total Assessment is a certain percentage of the fair market value that is determined by local assessors to be the total taxable value of land and additions on the property. | Land | Improvement |
|---|---|---|---|---|
| 2024 | $5,301 | $125,080 | $8,000 | $117,080 |
| 2023 | $3,979 | $100,800 | $8,000 | $92,800 |
| 2022 | $3,680 | $85,600 | $8,000 | $77,600 |
| 2021 | $2,703 | $61,680 | $8,000 | $53,680 |
| 2020 | $1,521 | $43,352 | $8,000 | $35,352 |
| 2019 | $1,384 | $38,887 | $6,400 | $32,487 |
| 2018 | $1,437 | $40,360 | $6,400 | $33,960 |
| 2017 | $1,407 | $39,418 | $6,400 | $33,018 |
| 2016 | $1,228 | $34,418 | $6,400 | $28,018 |
| 2015 | $1,080 | $0 | $0 | $0 |
| 2014 | $1,247 | $35,855 | $6,400 | $29,455 |
Source: Public Records
Map
Nearby Homes
- 6178 Graceland Cir
- 6051 Reynolds Rd
- 6083 Reynolds Rd
- 6155 Navaho Trail
- 0 SE Old Rex Morrow Rd Unit 142 8001665
- 1343 Burbank Trail
- 6429 Woodstone Way
- 6296 Flamingo Way
- 1217 Dove Ct
- 1331 Woodstone Trace
- 1337 Woodstone Trace
- 1329 Woodstone Trace
- 1394 Wood Cir S
- 6433 Stone Terrace
- 6433 Stone Way
- 6427 Stone Way Unit O10
- 6437 Stone Way Unit O5
- 6130 Graceland Cir
- 6138 Graceland Cir
- 6131 Graceland Cir
- 6142 Graceland Cir
- 6126 Graceland Cir
- 6122 Graceland Cir
- 6146 Graceland Cir
- 6143 Graceland Cir
- 6117 Graceland Cir
- 6150 Graceland Cir
- 6147 Graceland Cir
- 6118 Graceland Cir
- 6154 Graceland Cir
- 1428 Graceland Ct
- 6153 Graceland Cir
- 6114 Graceland Cir
- 1422 Graceland Ct
- 1414 Graceland Ct
- 1400 Graceland Ct
- 1432 Graceland Ct