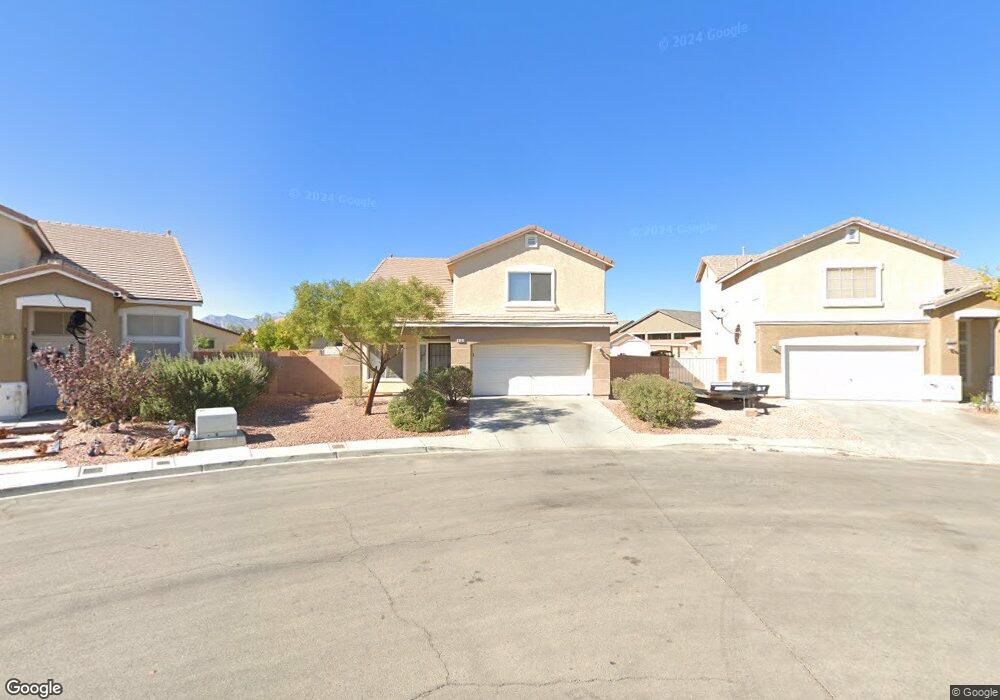
6135 Sage Hills Place Unit 2 North Las Vegas, NV 89031
Craig Ranch NeighborhoodEstimated Value: $433,865 - $481,000
4
Beds
3
Baths
1,946
Sq Ft
$231/Sq Ft
Est. Value
About This Home
This home is located at 6135 Sage Hills Place Unit 2, North Las Vegas, NV 89031 and is currently estimated at $450,466, approximately $231 per square foot. 6135 Sage Hills Place Unit 2 is a home located in Clark County with nearby schools including Goynes Elementary School, Brian & Teri Cram Middle School, and Shadow Ridge High School.
Ownership History
Date
Name
Owned For
Owner Type
Purchase Details
Closed on
Feb 4, 2019
Sold by
Bkd Equity Llc
Bought by
Bkd Rent Llc
Current Estimated Value
Home Financials for this Owner
Home Financials are based on the most recent Mortgage that was taken out on this home.
Original Mortgage
$11,071
Outstanding Balance
$9,733
Interest Rate
4.5%
Mortgage Type
Commercial
Estimated Equity
$440,733
Purchase Details
Closed on
Jun 30, 2011
Sold by
Layton James M and Layton Mary M
Bought by
Bkb Capital Llc
Purchase Details
Closed on
Jul 12, 2001
Sold by
Hh Res Llc
Bought by
Layton James M and Layton Mary M
Home Financials for this Owner
Home Financials are based on the most recent Mortgage that was taken out on this home.
Original Mortgage
$158,681
Interest Rate
7.26%
Mortgage Type
VA
Create a Home Valuation Report for This Property
The Home Valuation Report is an in-depth analysis detailing your home's value as well as a comparison with similar homes in the area
Home Values in the Area
Average Home Value in this Area
Purchase History
| Date | Buyer | Sale Price | Title Company |
|---|---|---|---|
| Bkd Rent Llc | -- | Os National Llc | |
| Bkd Equity Llc | -- | Os National Llc Rq | |
| Bkb Capital Llc | $91,500 | National Title Company | |
| Layton James M | $155,570 | United Title |
Source: Public Records
Mortgage History
| Date | Status | Borrower | Loan Amount |
|---|---|---|---|
| Open | Bkd Equity Llc | $11,071 | |
| Closed | Bkd Rent Llc | $11,071 | |
| Previous Owner | Layton James M | $158,681 |
Source: Public Records
Tax History Compared to Growth
Tax History
| Year | Tax Paid | Tax Assessment Tax Assessment Total Assessment is a certain percentage of the fair market value that is determined by local assessors to be the total taxable value of land and additions on the property. | Land | Improvement |
|---|---|---|---|---|
| 2025 | $1,976 | $104,244 | $33,250 | $70,994 |
| 2024 | $1,830 | $104,244 | $33,250 | $70,994 |
| 2023 | $1,830 | $97,307 | $30,100 | $67,207 |
| 2022 | $1,695 | $86,968 | $25,550 | $61,418 |
| 2021 | $1,569 | $81,225 | $22,750 | $58,475 |
| 2020 | $1,454 | $79,668 | $21,700 | $57,968 |
| 2019 | $1,359 | $76,665 | $19,845 | $56,820 |
| 2018 | $1,296 | $69,826 | $15,435 | $54,391 |
| 2017 | $2,264 | $67,505 | $14,630 | $52,875 |
| 2016 | $1,214 | $55,520 | $8,750 | $46,770 |
| 2015 | $1,211 | $42,804 | $7,000 | $35,804 |
| 2014 | $1,173 | $33,941 | $7,000 | $26,941 |
Source: Public Records
Map
Nearby Homes
- 4025 Fairywren Dr
- 6223 Orions Belt Peak St
- 6334 Orions Belt Peak St
- 6133 Turaco St
- 6314 Ruby Cedar Ct
- 4050 Midnight Crest Ave
- 4145 Midnight Crest Ave
- 6103 Harvest Dance St
- 3821 Champagne Wood Dr
- 6314 Shadow Moon Place
- 3605 Sapphire Sea Ct
- 3729 Shimmering Creek Ave
- 3517 Amish Ave
- 3604 Sandy Brown Ave
- 5923 Sunrise Creek St
- 5845 Gentle Creek Ln
- 3513 Mastercraft Ave
- 4233 Buteo Ln
- 6028 Stern Cove Ct
- 4482 Brasada Ranch Ct
- 4010 Passing Storm Ln
- 6152 Widowbird St
- 6156 Widowbird St
- 6148 Widowbird St
- 6127 Sage Hills Place Unit 2
- 6160 Widowbird St
- 4013 Aracari Dr
- 4017 Aracari Dr
- 4006 Passing Storm Ln
- 6144 Widowbird St
- 4009 Aracari Dr
- 6164 Widowbird St
- 6123 Sage Hills Place
- 4005 Aracari Dr
- 4005 Passing Storm Ln
- 4002 Passing Storm Ln Unit 2
- 6140 Widowbird St
- 3949 Aracari Dr
- 4001 Passing Storm Ln
- 3946 Passing Storm Ln Unit 2