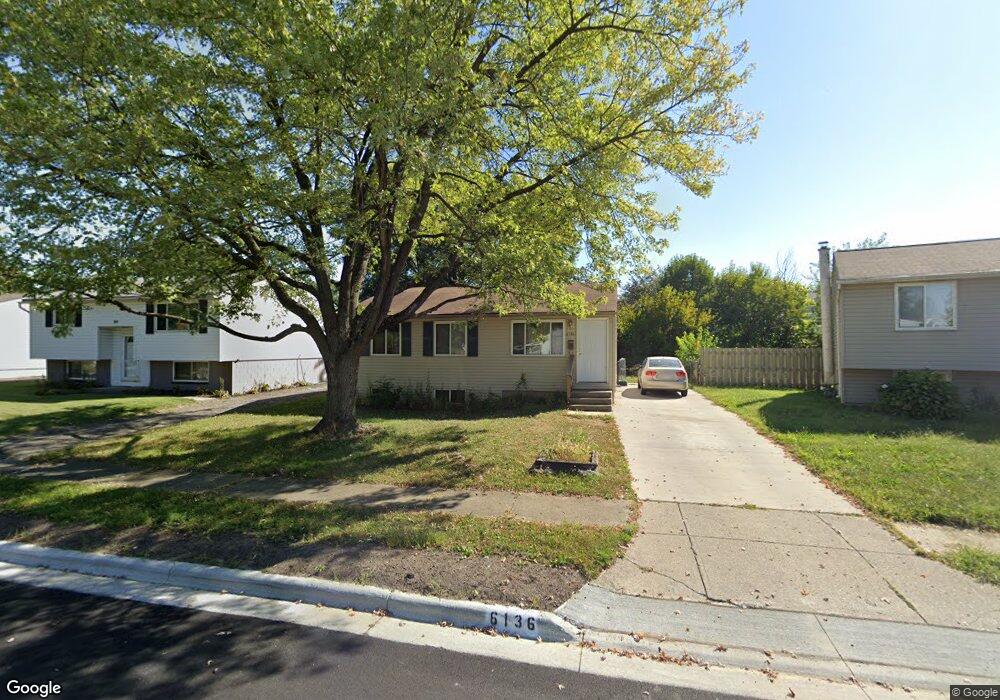
6136 Hanby Square E Columbus, OH 43229
Northern Woods NeighborhoodEstimated Value: $178,000 - $206,000
3
Beds
1
Bath
896
Sq Ft
$212/Sq Ft
Est. Value
About This Home
This home is located at 6136 Hanby Square E, Columbus, OH 43229 and is currently estimated at $190,285, approximately $212 per square foot. 6136 Hanby Square E is a home located in Franklin County with nearby schools including Northgate Intermediate, Alpine Elementary School, and Woodward Park Middle School.
Ownership History
Date
Name
Owned For
Owner Type
Purchase Details
Closed on
Aug 1, 2018
Sold by
Us Bank Na
Bought by
Rucker Troy Daniel
Current Estimated Value
Home Financials for this Owner
Home Financials are based on the most recent Mortgage that was taken out on this home.
Original Mortgage
$159,883
Outstanding Balance
$137,688
Interest Rate
4.5%
Mortgage Type
FHA
Estimated Equity
$52,597
Purchase Details
Closed on
Feb 26, 2018
Sold by
Lee Tracy
Bought by
Us Bank Na
Purchase Details
Closed on
Feb 24, 2010
Sold by
Hsbc Bank Usa
Bought by
3Km Llc
Purchase Details
Closed on
Feb 9, 2010
Sold by
Burt Michael G and Burt Emily A
Bought by
Hsbc Bank Usa Na
Purchase Details
Closed on
Mar 29, 2002
Sold by
Yelle Suzanne and Mcclure Suzanne
Bought by
Burt Michael G and Burt Emily A
Purchase Details
Closed on
Dec 1, 1980
Create a Home Valuation Report for This Property
The Home Valuation Report is an in-depth analysis detailing your home's value as well as a comparison with similar homes in the area
Home Values in the Area
Average Home Value in this Area
Purchase History
| Date | Buyer | Sale Price | Title Company |
|---|---|---|---|
| Rucker Troy Daniel | $110,000 | None Available | |
| Us Bank Na | $88,000 | None Available | |
| 3Km Llc | $65,000 | National | |
| Hsbc Bank Usa Na | $58,000 | None Available | |
| Burt Michael G | $88,000 | -- | |
| -- | $42,800 | -- |
Source: Public Records
Mortgage History
| Date | Status | Borrower | Loan Amount |
|---|---|---|---|
| Open | Rucker Troy Daniel | $159,883 |
Source: Public Records
Tax History
| Year | Tax Paid | Tax Assessment Tax Assessment Total Assessment is a certain percentage of the fair market value that is determined by local assessors to be the total taxable value of land and additions on the property. | Land | Improvement |
|---|---|---|---|---|
| 2025 | $2,371 | $51,730 | $13,650 | $38,080 |
| 2024 | $2,371 | $51,730 | $13,650 | $38,080 |
| 2023 | $2,341 | $51,730 | $13,650 | $38,080 |
| 2022 | $1,544 | $29,050 | $6,090 | $22,960 |
| 2021 | $1,547 | $29,050 | $6,090 | $22,960 |
| 2020 | $1,549 | $29,050 | $6,090 | $22,960 |
| 2019 | $1,485 | $23,880 | $5,080 | $18,800 |
| 2018 | $1,321 | $23,880 | $5,080 | $18,800 |
| 2017 | $1,485 | $23,880 | $5,080 | $18,800 |
| 2016 | $1,275 | $18,760 | $4,760 | $14,000 |
| 2015 | $1,160 | $18,760 | $4,760 | $14,000 |
| 2014 | $1,163 | $18,760 | $4,760 | $14,000 |
| 2013 | $674 | $22,050 | $5,600 | $16,450 |
Source: Public Records
Map
Nearby Homes
- 2197 Bayfield Dr
- 2292 Laurelwood Dr Unit 2292L
- 6048 Pinemoor St
- 1281 Home Acre Dr
- 6142 Laurelwood Ct Unit 144
- 2470 Carolina Ave Unit 66
- 6245 Sharon Woods Blvd
- 5885 Beechcroft Rd Unit 116
- 5885 Beechcroft Rd Unit 313
- 2623 Blendon Woods Blvd
- 5732 Beechcroft Rd Unit B
- 5726 Beechcroft Rd Unit J
- 1947 Rockdale Dr Unit 33
- 2713 Woodland Village Dr Unit 6
- 1679 Peardale Rd N
- 2721 Woodland Trail Dr Unit 2721
- 5556 Parkshire Dr Unit 5556
- 5570 Maple Canyon Ave
- 5491 Parkshire Dr Unit 5491
- 1635 Tendril Ct
- 6142 Hanby Square E
- 6130 Hanby Square E
- 6148 Hanby Square E
- 2206 Perkins Ct Unit 2206P
- 2208 Perkins Ct Unit 2208P
- 2183 Hanby Square S
- 2212 Perkins Ct
- 2174 Hanby Square S
- 2210 Perkins Ct Unit 2210P
- 2210 Perkins Ct Unit P
- 6156 Hanby Square E
- 2214 Perkins Ct Unit 2214P
- 2216 Perkins Ct
- 2218 Perkins Ct Unit 2218P
- 2220 Perkins Ct Unit 2220P
- 2177 Hanby Square S
- 2173 Hanby Square N
- 2166 Hanby Square S
- 2222 Perkins Ct Unit 2222P
- 6162 Hanby Square E
Your Personal Tour Guide
Ask me questions while you tour the home.