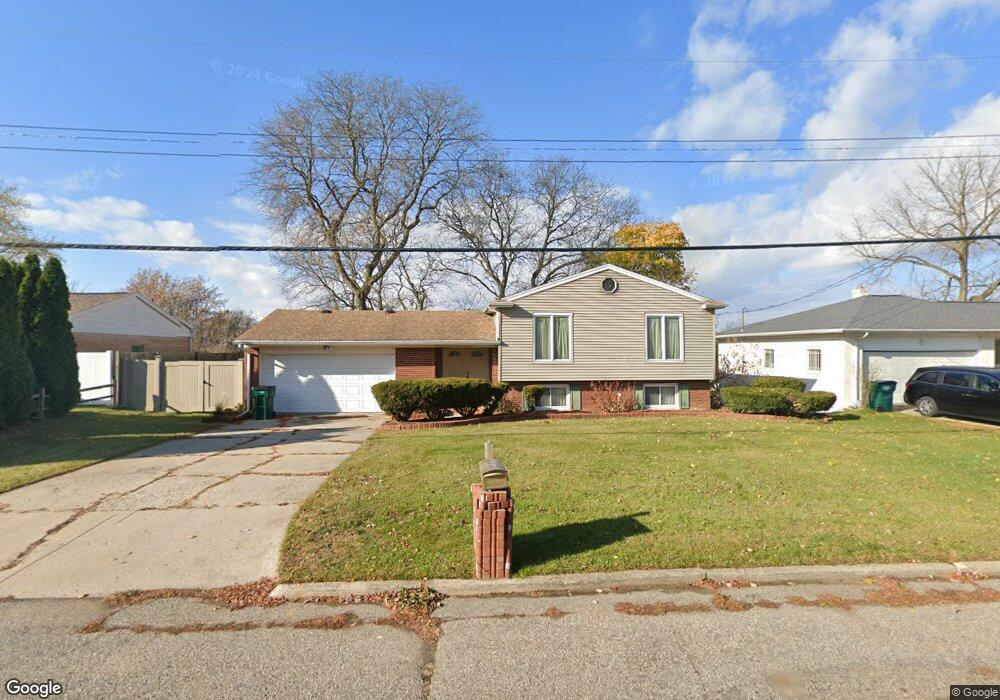
6136 Norburn Way Lansing, MI 48911
Southern Lansing NeighborhoodEstimated Value: $220,918 - $239,000
5
Beds
3
Baths
2,246
Sq Ft
$102/Sq Ft
Est. Value
About This Home
This home is located at 6136 Norburn Way, Lansing, MI 48911 and is currently estimated at $228,980, approximately $101 per square foot. 6136 Norburn Way is a home located in Ingham County with nearby schools including Forest View School, Attwood School, and Everett High School.
Ownership History
Date
Name
Owned For
Owner Type
Purchase Details
Closed on
Feb 2, 2006
Sold by
Knox Vernon and Knox Wanda
Bought by
Mortgage Electronic Registration Systems
Current Estimated Value
Purchase Details
Closed on
Sep 6, 2005
Sold by
Knox Wanda
Bought by
Knox Vernox
Purchase Details
Closed on
Feb 24, 2003
Sold by
Rios Gonzalo
Bought by
Knox Vernon
Home Financials for this Owner
Home Financials are based on the most recent Mortgage that was taken out on this home.
Original Mortgage
$140,000
Interest Rate
8.98%
Mortgage Type
Purchase Money Mortgage
Purchase Details
Closed on
Nov 1, 1992
Create a Home Valuation Report for This Property
The Home Valuation Report is an in-depth analysis detailing your home's value as well as a comparison with similar homes in the area
Home Values in the Area
Average Home Value in this Area
Purchase History
We collect this data history from publicly available records. To have your information removed, we recommend requesting removal directly through your county’s website.
| Date | Buyer | Sale Price | Title Company |
|---|---|---|---|
| Mortgage Electronic Registration Systems | $138,092 | None Available | |
| Knox Vernox | -- | None Available | |
| Knox Vernon | $140,000 | Trans | |
| -- | $80,000 | -- |
Source: Public Records
Mortgage History
We collect this data history from publicly available records. To have your information removed, we recommend requesting removal directly through your county’s website.
| Date | Status | Borrower | Loan Amount |
|---|---|---|---|
| Previous Owner | Knox Vernon | $140,000 |
Source: Public Records
Tax History
| Year | Tax Paid | Tax Assessment Tax Assessment Total Assessment is a certain percentage of the fair market value that is determined by local assessors to be the total taxable value of land and additions on the property. | Land | Improvement |
|---|---|---|---|---|
| 2025 | $3,663 | $110,000 | $12,700 | $97,300 |
| 2024 | $36 | $86,100 | $12,700 | $73,400 |
| 2023 | $3,985 | $78,300 | $12,700 | $65,600 |
| 2022 | $3,635 | $67,700 | $12,700 | $55,000 |
| 2021 | $3,550 | $61,900 | $9,300 | $52,600 |
| 2020 | $3,526 | $58,600 | $9,300 | $49,300 |
| 2019 | $3,409 | $53,900 | $9,300 | $44,600 |
| 2018 | $3,230 | $48,200 | $9,300 | $38,900 |
| 2017 | $3,110 | $48,200 | $9,300 | $38,900 |
| 2016 | $2,987 | $42,700 | $9,300 | $33,400 |
| 2015 | $2,987 | $41,000 | $18,649 | $22,351 |
| 2014 | $2,987 | $40,200 | $27,125 | $13,075 |
Source: Public Records
Map
Nearby Homes
- 6257 Beechfield Dr Unit 24
- 6264 Beechfield Dr Unit 97
- 6300 Beechfield Dr Unit 87
- 6331 Beechfield Dr Unit 42
- 6310 Beechfield Dr Unit 92
- 6113 Scotmar Dr
- 6422 Lerner Way
- 6704 Mill Stream Ln
- 1265 Roth Dr
- 6741 Helman Blvd Unit lot 203
- 1931 Carson St
- 4485 Helmsway Dr
- 5700 Orchard Ct
- 2702 Yachtsman Dr
- 2670 Brigantine Dr
- 4410 Harding Ave
- 0 N Aurelius Rd
- 5019 Devonshire Ave
- 208 E Northrup St
- 2545 Limerick Cir Unit 8
- 6144 Norburn Way
- 6128 Norburn Way
- 6204 Norburn Way
- 6120 Norburn Way
- 6137 Norburn Way
- 6129 Norburn Way
- 6145 Norburn Way
- 6129 Beechfield Dr
- 6201 Norburn Way
- 6212 Norburn Way
- 6123 Norburn Way
- 6201 Beechfield Dr
- 6225 Beechfield Dr Unit 9
- 6136 Marscot Dr
- 6227 Beechfield Dr Unit 10
- 6128 Marscot Dr
- 6144 Marscot Dr
- 1432 E Ller
- 6221 Beechfield Dr Unit 7
- 6211 Norburn Way
Your Personal Tour Guide
Ask me questions while you tour the home.