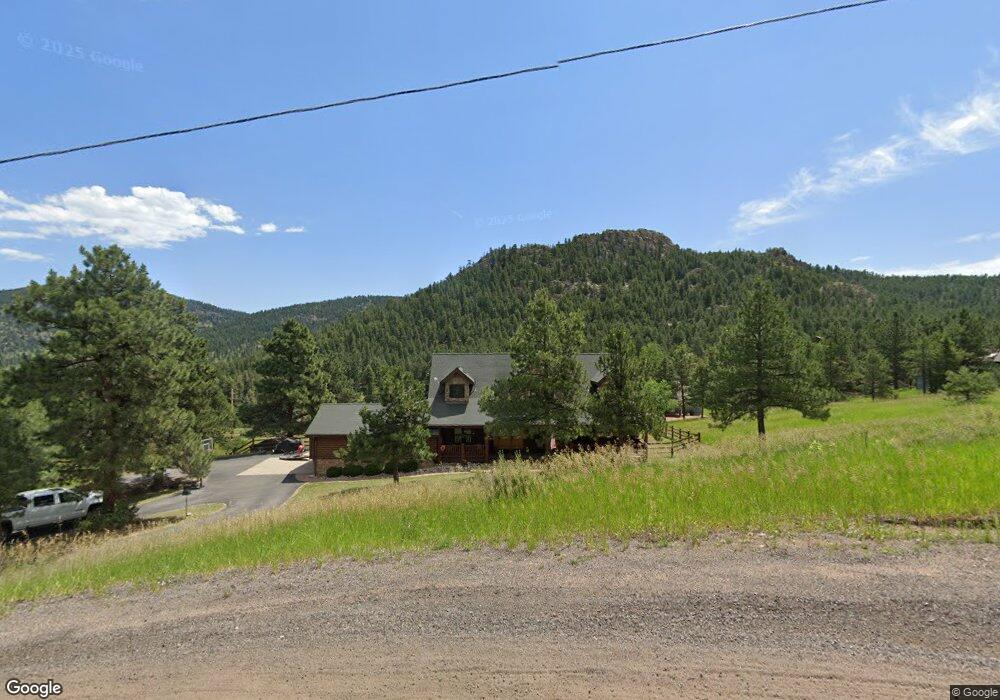
6138 S Skyline Dr Evergreen, CO 80439
Evergreen Meadows NeighborhoodEstimated Value: $1,245,856 - $1,435,000
3
Beds
5
Baths
4,226
Sq Ft
$317/Sq Ft
Est. Value
About This Home
This home is located at 6138 S Skyline Dr, Evergreen, CO 80439 and is currently estimated at $1,339,964, approximately $317 per square foot. 6138 S Skyline Dr is a home located in Jefferson County with nearby schools including Wilmot Elementary School, Evergreen Middle School, and Evergreen High School.
Ownership History
Date
Name
Owned For
Owner Type
Purchase Details
Closed on
Apr 6, 2022
Sold by
Lynn Steadman Gina
Bought by
Steadman Gina Lynn and Lieb Kimberly Ann
Current Estimated Value
Purchase Details
Closed on
May 27, 2020
Sold by
Patterson Steve G
Bought by
Steadman Gina Lynn and Lieb Kimberly Ann
Purchase Details
Closed on
Mar 2, 2016
Sold by
Staab Kenneth J and Staab Suzanne I
Bought by
Steadman Gina Lynn and Lieb Kimberly Ann
Home Financials for this Owner
Home Financials are based on the most recent Mortgage that was taken out on this home.
Original Mortgage
$417,000
Interest Rate
3.79%
Mortgage Type
New Conventional
Purchase Details
Closed on
Nov 7, 2006
Sold by
Staab Kenneth J
Bought by
Staab Kenneth J and Staab Suzanne I
Purchase Details
Closed on
Jul 31, 2002
Sold by
Monkman Richard Willis
Bought by
Staab Kenneth J
Purchase Details
Closed on
Sep 13, 2000
Sold by
Dell Robert F and Dell Susan D
Bought by
Monkman Richard Willis
Create a Home Valuation Report for This Property
The Home Valuation Report is an in-depth analysis detailing your home's value as well as a comparison with similar homes in the area
Home Values in the Area
Average Home Value in this Area
Purchase History
| Date | Buyer | Sale Price | Title Company |
|---|---|---|---|
| Steadman Gina Lynn | -- | None Listed On Document | |
| Steadman Gina Lynn | -- | None Available | |
| Steadman Gina Lynn | $675,000 | First American | |
| Staab Kenneth J | -- | None Available | |
| Staab Kenneth J | $139,500 | Land Title | |
| Monkman Richard Willis | $95,000 | -- |
Source: Public Records
Mortgage History
| Date | Status | Borrower | Loan Amount |
|---|---|---|---|
| Previous Owner | Steadman Gina Lynn | $417,000 |
Source: Public Records
Tax History Compared to Growth
Tax History
| Year | Tax Paid | Tax Assessment Tax Assessment Total Assessment is a certain percentage of the fair market value that is determined by local assessors to be the total taxable value of land and additions on the property. | Land | Improvement |
|---|---|---|---|---|
| 2024 | $6,067 | $66,153 | $18,078 | $48,075 |
| 2023 | $6,067 | $66,153 | $18,078 | $48,075 |
| 2022 | $4,289 | $47,010 | $7,394 | $39,616 |
| 2021 | $4,289 | $46,231 | $5,475 | $40,756 |
| 2020 | $4,443 | $47,517 | $11,756 | $35,761 |
| 2019 | $4,381 | $47,517 | $11,756 | $35,761 |
| 2018 | $4,211 | $44,177 | $8,354 | $35,823 |
| 2017 | $3,834 | $44,177 | $8,354 | $35,823 |
| 2016 | $4,384 | $47,208 | $8,395 | $38,813 |
| 2015 | $4,008 | $47,208 | $8,395 | $38,813 |
| 2014 | $4,008 | $41,876 | $9,097 | $32,779 |
Source: Public Records
Map
Nearby Homes
- 6068 S Skyline Dr
- 5925 Herzman Dr
- 6187 Stone Creek Dr
- 6056 Stone Creek Dr
- 26978 Mesa Dr
- 6703 Wild Rose Ln
- 6371 Canyon Creek Rd Unit 12
- 28465 Cragmont Dr
- 25925 Lost Cabin Trail Unit 39-43
- 6684 Olympus Dr
- 5525 S Twin Spruce Dr
- 6917 Timbers Dr
- 5720 Northwood Dr
- 5162 S Road A
- 26130 Edelweiss Cir
- 5233 S Road A
- 25728 Stanley Park Rd
- 26367 Bell Park Dr
- 5020 Liberty Dr
- 0 Fern Gulch Unit REC6395499
- 6128 S Skyline Dr
- 6121 Kinney Creek Rd
- 6158 S Skyline Dr
- 6141 Kinney Creek Rd
- 6068 S Skyline Dr Unit 15
- 6056 Oberstrasse Rd
- 6179 S Skyline Dr
- 6057 Oberstrasse Rd
- 6151 Kinney Creek Rd
- 6159 S Skyline Dr
- 6080 Kinney Creek Rd
- 27474 Mildred Ln
- 0 S Skyline Dr
- 6178 S Skyline Dr
- 6066 Oberstrasse Rd
- 6248 S Skyline Dr
- 6199 S Skyline Dr
- 6067 Oberstrasse Rd
- 6209 S Skyline Dr
- 6211 Kinney Creek Rd