
Seller's Agent in 2025
DeAnn Yount
NEXT GEN REALTY
(386) 212-6537
9 in this area
60 Total Sales
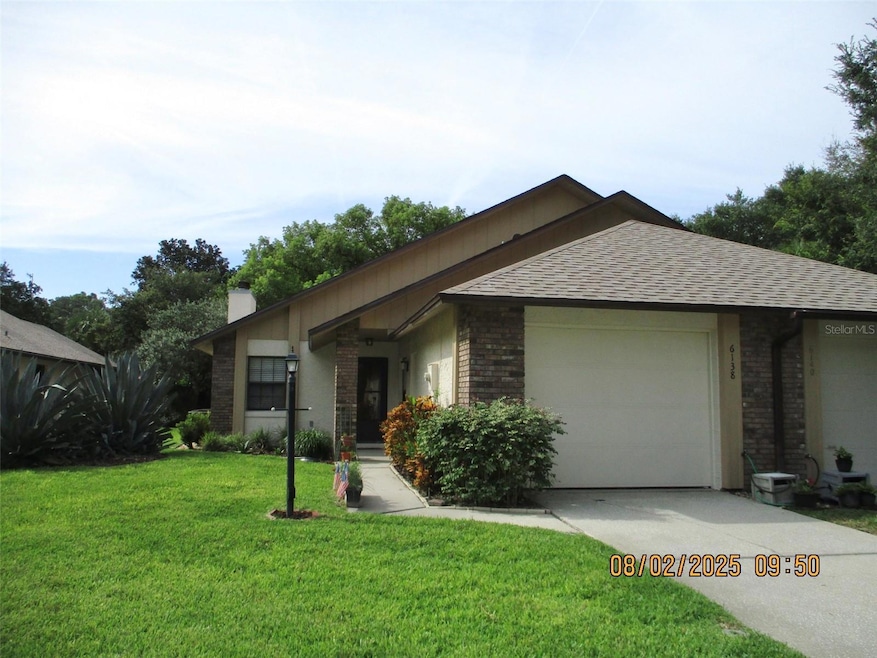
Beautifully Maintained 2-Bedroom in Riverwood Plantation - Minutes to the Beach. Move-in-ready 2-bedroom, 2-bath in the highly desirable Riverwood Plantation community of Port Orange—just minutes from the beach, shopping, dining, and top-rated schools. This light-filled home offers a bright, open layout with spacious living areas, a well-appointed kitchen, and a private outdoor retreat. The primary suite features shower and walk-in closet, with a guest bedroom and full bath. Recent upgrades include a 2024 roof with plywood, a 2024 refrigerator, and an HVAC system approximately 4-5 years old with regular service. Enjoy resort-style amenities including a clubhouse, pool, tennis, pickleball, racquetball, basketball, scenic boardwalk, fishing pier, and private boat launch to Spruce Creek River. Don't miss your chance to own a move-in-ready home in one of Port Orange's most coveted neighborhoods! Life in Riverwood Plantation offers more than just a homeit's a lifestyle. Residents enjoy access to a clubhouse with a full kitchen, a sparkling swimming pool, and a variety of sports courts including pickleball, racquetball, basketball, and tennis. Scenic nature boardwalks lead to a fishing pier and gazebo, and a private boat launch provides access to the beautiful Spruce Creek River. Don't miss the opportunity to make this move-in-ready home yours in one of Port Orange's most coveted neighborhoods.
Last Agent to Sell the Property
NEXT GEN REALTY Brokerage Phone: 386-492-7837 License #482522 Listed on: 08/21/2025
| Date | Type | Sale Price | Title Company |
|---|---|---|---|
| Warranty Deed | $212,000 | Professional Title | |
| Warranty Deed | $162,000 | Adams Cameron Title Svcs Inc | |
| Warranty Deed | $115,000 | -- | |
| Warranty Deed | $91,500 | -- | |
| Deed | $73,400 | -- | |
| Deed | $100 | -- | |
| Deed | $100 | -- |
| Date | Status | Loan Amount | Loan Type |
|---|---|---|---|
| Open | $197,160 | New Conventional | |
| Previous Owner | $128,000 | Fannie Mae Freddie Mac | |
| Previous Owner | $85,000 | Purchase Money Mortgage |
| Date | Event | Price | List to Sale | Price per Sq Ft |
|---|---|---|---|---|
| 12/26/2025 12/26/25 | Sold | $200,000 | -13.4% | $176 / Sq Ft |
| 11/24/2025 11/24/25 | Pending | -- | -- | -- |
| 09/25/2025 09/25/25 | Price Changed | $230,900 | -2.1% | $204 / Sq Ft |
| 08/21/2025 08/21/25 | For Sale | $235,900 | -- | $208 / Sq Ft |
| Year | Tax Paid | Tax Assessment Tax Assessment Total Assessment is a certain percentage of the fair market value that is determined by local assessors to be the total taxable value of land and additions on the property. | Land | Improvement |
|---|---|---|---|---|
| 2026 | $3,718 | $202,428 | $49,000 | $153,428 |
| 2025 | $3,718 | $208,826 | $49,000 | $159,826 |
| 2024 | $3,336 | $210,243 | $49,000 | $161,243 |
| 2023 | $3,336 | $209,145 | $47,500 | $161,645 |
| 2022 | $2,936 | $169,896 | $26,000 | $143,896 |
| 2021 | $2,764 | $141,649 | $21,000 | $120,649 |
| 2020 | $2,656 | $140,461 | $16,000 | $124,461 |
| 2019 | $2,458 | $136,228 | $16,000 | $120,228 |
| 2018 | $2,253 | $116,895 | $10,000 | $106,895 |
| 2017 | $2,139 | $109,447 | $10,000 | $99,447 |
| 2016 | $1,963 | $92,900 | $0 | $0 |
| 2015 | $1,932 | $87,847 | $0 | $0 |
| 2014 | $1,840 | $82,260 | $0 | $0 |
Seller's Agent in 2025
DeAnn Yount
NEXT GEN REALTY
(386) 212-6537
9 in this area
60 Total Sales
S
Buyer's Agent in 2025
Stellar Non-Member Agent
FL_MFRMLS
Source: Stellar MLS
MLS Number: V4944472
APN: 6338-08-00-0590
Disclaimer: Certain information contained herein is derived from information provided by parties other than Homes.com. All information provided is deemed reliable, but is not guaranteed to be accurate and should be independently verified.
![]() Based on information submitted to the MLS GRID. All data is obtained from various sources and may not have been verified by broker or MLS GRID. Supplied Open House Information is subject to change without notice. All information should be independently reviewed and verified for accuracy. Properties may or may not be listed by the office/agent presenting the information. Some IDX listings have been excluded from this website. IDX information is provided exclusively for personal, non-commercial use, and may not be used for any purpose other than to identify prospective properties consumers may be interested in purchasing. Information is deemed reliable but not guaranteed.
Based on information submitted to the MLS GRID. All data is obtained from various sources and may not have been verified by broker or MLS GRID. Supplied Open House Information is subject to change without notice. All information should be independently reviewed and verified for accuracy. Properties may or may not be listed by the office/agent presenting the information. Some IDX listings have been excluded from this website. IDX information is provided exclusively for personal, non-commercial use, and may not be used for any purpose other than to identify prospective properties consumers may be interested in purchasing. Information is deemed reliable but not guaranteed.
Based on information submitted to the MLS GRID
Listing Information presented by local MLS brokerage: Ten-X - (888)-952-6393
Ask me questions while you tour the home.