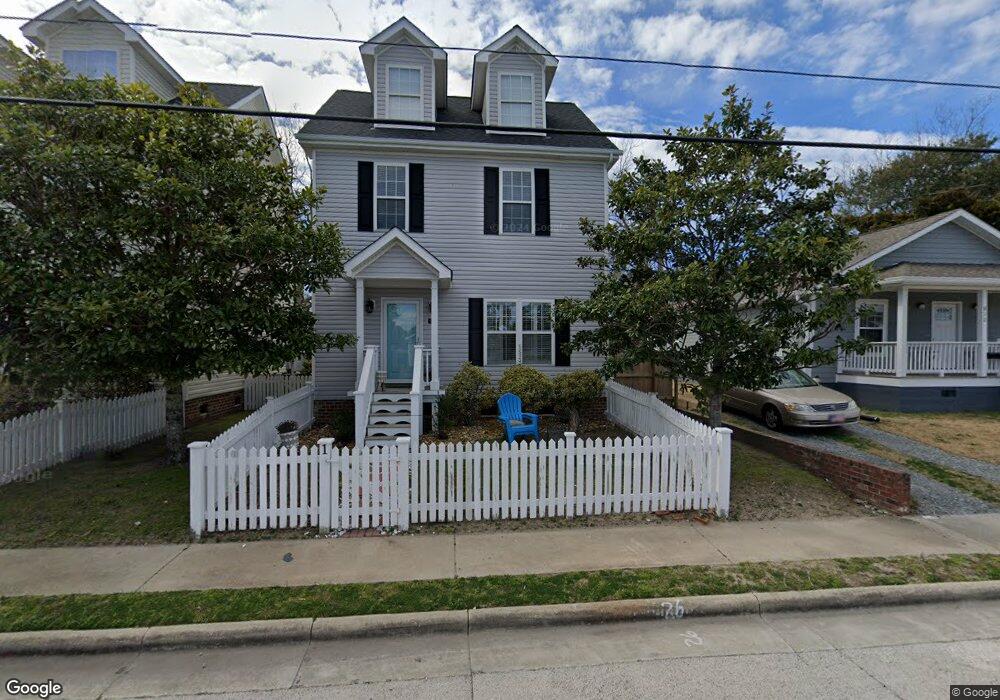
614 Cedar St Unit 2 Beaufort, NC 28516
Estimated Value: $377,039 - $481,000
3
Beds
4
Baths
828
Sq Ft
$500/Sq Ft
Est. Value
About This Home
This home is located at 614 Cedar St Unit 2, Beaufort, NC 28516 and is currently estimated at $414,260, approximately $500 per square foot. 614 Cedar St Unit 2 is a home located in Carteret County with nearby schools including Beaufort Elementary School, Beaufort Middle School, and East Carteret High School.
Ownership History
Date
Name
Owned For
Owner Type
Purchase Details
Closed on
Oct 27, 2020
Sold by
Mills W D W and Mills Frances Scott
Bought by
Turner Jacob E and Turner Terry M
Current Estimated Value
Purchase Details
Closed on
Sep 30, 2008
Sold by
Galewski Chester and Galewski Deborah
Bought by
Mills W D and Mills W
Home Financials for this Owner
Home Financials are based on the most recent Mortgage that was taken out on this home.
Original Mortgage
$174,000
Interest Rate
5.78%
Mortgage Type
Unknown
Purchase Details
Closed on
Nov 28, 2005
Sold by
Cdc Cedar Pollock Llc
Bought by
Galewski Chester and Galewski Deborah
Home Financials for this Owner
Home Financials are based on the most recent Mortgage that was taken out on this home.
Original Mortgage
$156,000
Interest Rate
5.75%
Mortgage Type
Fannie Mae Freddie Mac
Create a Home Valuation Report for This Property
The Home Valuation Report is an in-depth analysis detailing your home's value as well as a comparison with similar homes in the area
Home Values in the Area
Average Home Value in this Area
Purchase History
| Date | Buyer | Sale Price | Title Company |
|---|---|---|---|
| Turner Jacob E | $255,000 | None Available | |
| Mills W D | $205,000 | None Available | |
| Galewski Chester | $195,000 | None Available |
Source: Public Records
Mortgage History
| Date | Status | Borrower | Loan Amount |
|---|---|---|---|
| Previous Owner | Mills W D | $174,000 | |
| Previous Owner | Galewski Chester | $156,000 |
Source: Public Records
Tax History Compared to Growth
Tax History
| Year | Tax Paid | Tax Assessment Tax Assessment Total Assessment is a certain percentage of the fair market value that is determined by local assessors to be the total taxable value of land and additions on the property. | Land | Improvement |
|---|---|---|---|---|
| 2025 | $2,008 | $331,347 | $50,000 | $281,347 |
| 2024 | $779 | $72,185 | $71,200 | $985 |
| 2023 | $684 | $72,185 | $71,200 | $985 |
| 2022 | $668 | $72,185 | $71,200 | $985 |
| 2021 | $668 | $71,200 | $71,200 | $0 |
| 2020 | $668 | $71,200 | $71,200 | $0 |
| 2019 | $1,741 | $202,169 | $100,000 | $102,169 |
| 2017 | $1,594 | $202,169 | $100,000 | $102,169 |
| 2016 | $1,503 | $202,169 | $100,000 | $102,169 |
| 2015 | $1,483 | $202,169 | $100,000 | $102,169 |
| 2014 | $1,363 | $198,292 | $95,000 | $103,292 |
Source: Public Records
Map
Nearby Homes
- 717 Cedar St Unit 1/2
- 420 Pollock St
- 601 Craven St
- 708 Ann St
- 200 Craven St
- 217 Turner St
- 301 Hedrick St
- 301 Broad St
- 805 Mulberry St Unit 202
- 805 Mulberry St Unit 204
- 805 Mulberry St Unit 105
- 805 Mulberry St Unit 201
- 805 Mulberry St Unit 104
- 805 Mulberry St Unit 103
- 805 Mulberry St Unit 102
- 805 Mulberry St Unit 101
- 217 Broad St
- 903 Live Oak St
- 1011 Front St Unit 3A
- 1308 Ann St Unit 16
- 614 Cedar St Unit 1
- 614 Cedar St
- 612 Cedar
- 610 Cedar St
- 608 Cedar St
- 315 Pollock St Unit 1
- 315 Pollock St Unit 2
- 315 Pollock St Unit 3
- 315 Pollock St Unit 4
- 315 Pollock St Unit 5
- 315 Pollock St Unit 6
- 315 Pollock St
- 611 Cedar St
- 613 Cedar St
- 309 Pollock St
- 307 Pollock St
- 601 Cedar St Unit 4
- 601 Cedar St Unit 7
- 601 Cedar St Unit 5
- 601 Cedar St Unit 4 or D