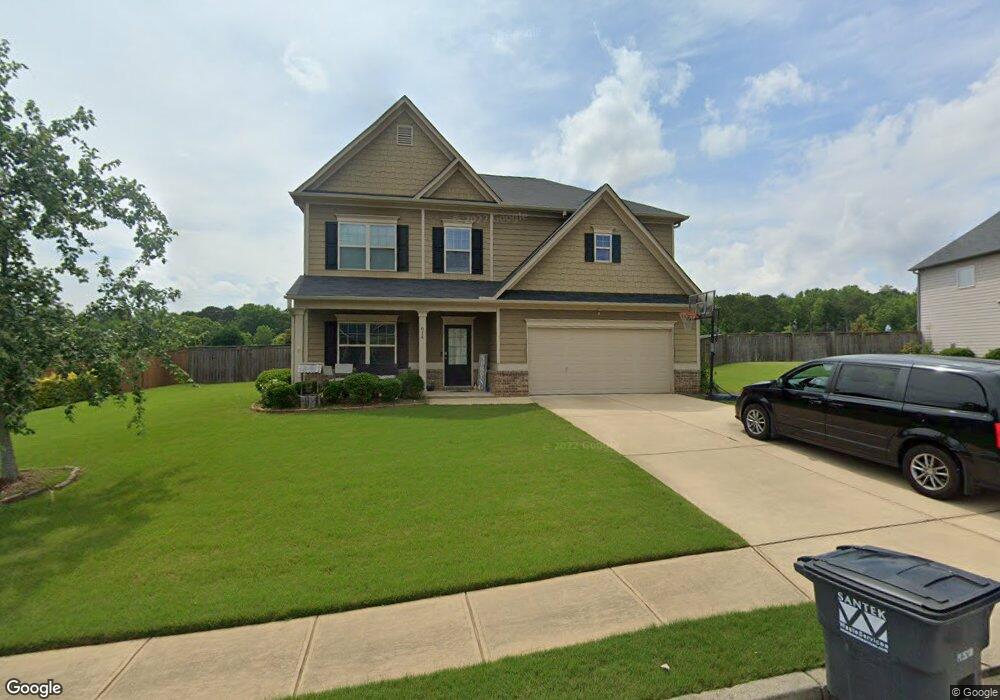
614 Darnell Rd Canton, GA 30115
Estimated Value: $526,000 - $557,132
5
Beds
3
Baths
2,956
Sq Ft
$183/Sq Ft
Est. Value
About This Home
This home is located at 614 Darnell Rd, Canton, GA 30115 and is currently estimated at $541,566, approximately $183 per square foot. 614 Darnell Rd is a home located in Cherokee County with nearby schools including Hickory Flat Elementary School, Rusk Middle School, and Sequoyah High School.
Ownership History
Date
Name
Owned For
Owner Type
Purchase Details
Closed on
May 24, 2017
Sold by
Hatoum Nassir
Bought by
Hatoum Nassir and Elissar Hatoum
Current Estimated Value
Home Financials for this Owner
Home Financials are based on the most recent Mortgage that was taken out on this home.
Original Mortgage
$278,350
Outstanding Balance
$231,652
Interest Rate
4.3%
Mortgage Type
New Conventional
Estimated Equity
$309,914
Purchase Details
Closed on
Apr 13, 2017
Sold by
Perry Dustin W
Bought by
Hatoum Nassir
Home Financials for this Owner
Home Financials are based on the most recent Mortgage that was taken out on this home.
Original Mortgage
$278,350
Outstanding Balance
$231,652
Interest Rate
4.3%
Mortgage Type
New Conventional
Estimated Equity
$309,914
Purchase Details
Closed on
Feb 3, 2015
Sold by
Perry Dustin W
Bought by
Perry Dustin W and Perry Abigail Elizabeth
Home Financials for this Owner
Home Financials are based on the most recent Mortgage that was taken out on this home.
Original Mortgage
$222,612
Interest Rate
4.75%
Mortgage Type
FHA
Create a Home Valuation Report for This Property
The Home Valuation Report is an in-depth analysis detailing your home's value as well as a comparison with similar homes in the area
Home Values in the Area
Average Home Value in this Area
Purchase History
| Date | Buyer | Sale Price | Title Company |
|---|---|---|---|
| Hatoum Nassir | $258,700 | -- | |
| Hatoum Nassir | $293,000 | -- | |
| Perry Dustin W | -- | -- |
Source: Public Records
Mortgage History
| Date | Status | Borrower | Loan Amount |
|---|---|---|---|
| Open | Hatoum Nassir | $278,350 | |
| Previous Owner | Perry Dustin W | $222,612 |
Source: Public Records
Tax History
| Year | Tax Paid | Tax Assessment Tax Assessment Total Assessment is a certain percentage of the fair market value that is determined by local assessors to be the total taxable value of land and additions on the property. | Land | Improvement |
|---|---|---|---|---|
| 2025 | $4,956 | $211,040 | $44,000 | $167,040 |
| 2024 | $4,591 | $193,040 | $40,000 | $153,040 |
| 2023 | $4,374 | $203,440 | $40,000 | $163,440 |
| 2022 | $4,319 | $177,760 | $36,000 | $141,760 |
| 2021 | $3,712 | $136,160 | $26,000 | $110,160 |
| 2020 | $3,359 | $120,800 | $24,000 | $96,800 |
| 2019 | $3,352 | $120,520 | $24,000 | $96,520 |
| 2018 | $3,394 | $118,720 | $18,000 | $100,720 |
| 2017 | $2,981 | $258,700 | $18,000 | $85,480 |
| 2016 | $2,641 | $226,800 | $16,400 | $74,320 |
| 2015 | $1,782 | $151,500 | $16,400 | $44,200 |
Source: Public Records
Map
Nearby Homes
- 200 Cherokee Reserve Cir
- 292 Harmony Lake Dr
- 417 Darnell Rd
- 213 Whitetail Cir
- 412 Middlebrooke St
- 501 Middlebrooke Trace
- 177 Treeline Trail
- 312 Sassafras Crossing
- 202 Hickory Nut Ln
- 515 Cobblestone Ct
- 243 Harmony Lake Dr
- 778 Crescent Cir
- 242 Harmony Lake Dr
- 315 Ellenton Place
- 642 Royal Crest Ct
- 626 Royal Crest Ct
- 408 Long Branch Way
- 121 Treeline Trail
- 710 Rockwood Ct
- 335 Mcdaniel Place
- 616 Darnell Rd
- 612 Darnell Rd
- 180 Cherokee Reserve Cir Unit 63
- 180 Cherokee Reserve Cir
- 178 Cherokee Reserve Cir Unit 64
- 178 Cherokee Reserve Cir
- 176 Cherokee Reserve Cir Unit 65
- 176 Cherokee Reserve Cir
- 613 Darnell Rd
- 174 Cherokee Reserve Cir Unit 66
- 174 Cherokee Reserve Cir
- 618 Darnell Rd
- 182 Cherokee Reserve Cir Unit 62
- 182 Cherokee Reserve Cir
- 609 Darnell Rd
- 615 Darnell Rd
- 610 Darnell Rd
- 172 Cherokee Reserve Cir Unit 67
- 184 Cherokee Reserve Cir
- 186 Cherokee Reserve Cir
Your Personal Tour Guide
Ask me questions while you tour the home.