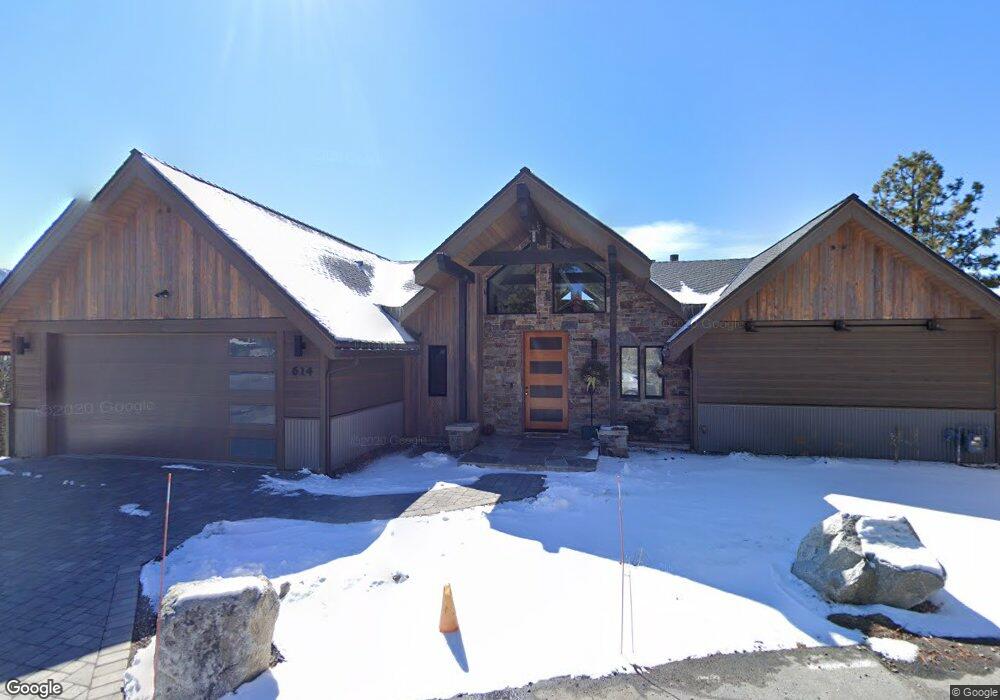
614 Don Dr Zephyr Cove, NV 89448
Estimated Value: $2,360,000 - $3,679,000
Studio
--
Bath
3,708
Sq Ft
$869/Sq Ft
Est. Value
About This Home
This home is located at 614 Don Dr, Zephyr Cove, NV 89448 and is currently estimated at $3,222,595, approximately $869 per square foot. 614 Don Dr is a home with nearby schools including Zephyr Cove Elementary School, George Whittell High School, and Douglas County High School.
Ownership History
Date
Name
Owned For
Owner Type
Purchase Details
Closed on
Nov 12, 2025
Sold by
Ronald J Michelsen Trust and Michelsen Lukonus J
Bought by
Carole A Michelsen Trust and Michelsen
Current Estimated Value
Purchase Details
Closed on
May 22, 2020
Sold by
Michelsen Ronald J and Ronald J Michelsen Trust
Bought by
Michelsen Ronald J and Ronald J Michelsen Trust
Home Financials for this Owner
Home Financials are based on the most recent Mortgage that was taken out on this home.
Original Mortgage
$1,000,000
Interest Rate
3.65%
Mortgage Type
New Conventional
Purchase Details
Closed on
Sep 3, 2019
Sold by
Michelsen Ronald J and Michelsen Carole A
Bought by
Michelsen Ronald J and Ronald J Michelsen Trust
Purchase Details
Closed on
Feb 23, 2005
Sold by
Michelsen Ronald J
Bought by
Michelsen Ronald J and Michelsen Carole A
Home Financials for this Owner
Home Financials are based on the most recent Mortgage that was taken out on this home.
Original Mortgage
$400,000
Interest Rate
5.73%
Mortgage Type
Credit Line Revolving
Create a Home Valuation Report for This Property
The Home Valuation Report is an in-depth analysis detailing your home's value as well as a comparison with similar homes in the area
Home Values in the Area
Average Home Value in this Area
Purchase History
| Date | Buyer | Sale Price | Title Company |
|---|---|---|---|
| Carole A Michelsen Trust | -- | None Listed On Document | |
| Michelsen Ronald J | -- | Boston National Title Agency | |
| Michelsen Ronald J | -- | None Available | |
| Michelsen Ronald J | -- | T S I Title | |
| Michelsen Ronald J | -- | T S I Title |
Source: Public Records
Mortgage History
| Date | Status | Borrower | Loan Amount |
|---|---|---|---|
| Previous Owner | Michelsen Ronald J | $1,000,000 | |
| Previous Owner | Michelsen Ronald J | $400,000 |
Source: Public Records
Tax History
| Year | Tax Paid | Tax Assessment Tax Assessment Total Assessment is a certain percentage of the fair market value that is determined by local assessors to be the total taxable value of land and additions on the property. | Land | Improvement |
|---|---|---|---|---|
| 2026 | $16,806 | $595,665 | $273,000 | $322,665 |
| 2025 | $16,325 | $602,015 | $273,000 | $329,015 |
| 2024 | $15,880 | $601,454 | $273,000 | $328,454 |
| 2023 | $15,880 | $575,797 | $273,000 | $302,797 |
| 2022 | $15,382 | $554,570 | $273,000 | $281,570 |
| 2021 | $14,917 | $504,257 | $238,000 | $266,257 |
| 2020 | $14,485 | $497,265 | $238,000 | $259,265 |
| 2019 | $14,067 | $490,865 | $238,000 | $252,865 |
| 2018 | $12,846 | $408,988 | $227,500 | $181,488 |
| 2017 | $5,631 | $315,288 | $227,500 | $87,788 |
| 2016 | $5,631 | $294,334 | $227,500 | $66,834 |
| 2015 | $5,651 | $294,334 | $227,500 | $66,834 |
| 2014 | $5,479 | $290,825 | $227,500 | $63,325 |
Source: Public Records
Map
Nearby Homes
- 605 Jerry Dr
- 227 S Martin Dr
- 621 Lakeview Dr
- 664 Lookout Rd
- 670 Riven Rock Rd
- 600 Highway 50 Unit 25
- 625 Lake Shore Blvd
- 644 Job Ln
- 748 Highway 50
- 259 Mc Faul Ct
- 462 Reno Ave
- 28 Beach Club Dr Unit 407
- 28 Beach Club Dr Unit 403
- 230 Clubhouse Cir
- 33 Beach Club Dr Unit 506
- 233 Clubhouse Cir
- 46 Beach Club Dr Unit 901
- 205 Clubhouse Cir
- 176 Tahoma Cir Unit A
- 100 Lake Village Unit B
Your Personal Tour Guide
Ask me questions while you tour the home.