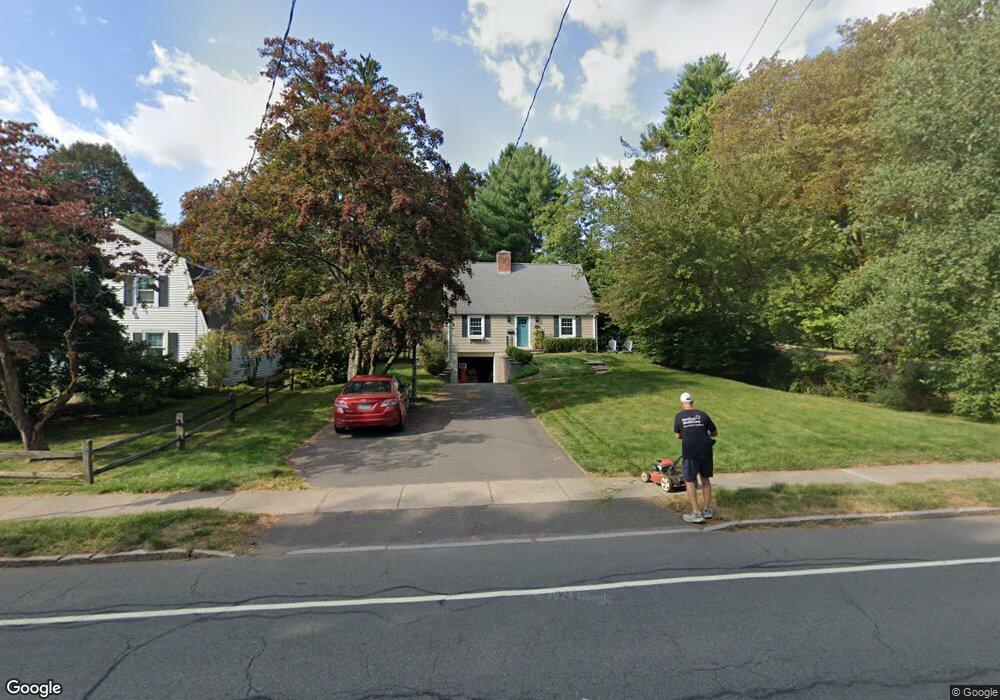
614 Fern St West Hartford, CT 06107
Estimated Value: $493,000 - $549,000
3
Beds
2
Baths
1,724
Sq Ft
$300/Sq Ft
Est. Value
About This Home
This home is located at 614 Fern St, West Hartford, CT 06107 and is currently estimated at $517,725, approximately $300 per square foot. 614 Fern St is a home located in Hartford County with nearby schools including Braeburn School, Sedgwick Middle School, and Conard High School.
Ownership History
Date
Name
Owned For
Owner Type
Purchase Details
Closed on
Jun 23, 2010
Sold by
Moen Thomas G and Moen Sarah L
Bought by
Diamond Garrett and Diamond Katy
Current Estimated Value
Home Financials for this Owner
Home Financials are based on the most recent Mortgage that was taken out on this home.
Original Mortgage
$320,681
Outstanding Balance
$217,852
Interest Rate
5.25%
Mortgage Type
FHA
Estimated Equity
$299,873
Purchase Details
Closed on
Jul 26, 2007
Sold by
Discovery Bay Llc
Bought by
Moen Thomas G and Moen Sarah L
Home Financials for this Owner
Home Financials are based on the most recent Mortgage that was taken out on this home.
Original Mortgage
$302,500
Interest Rate
6.78%
Purchase Details
Closed on
Feb 20, 2007
Sold by
Smith Robin
Bought by
Discovery Bay Llc
Purchase Details
Closed on
Feb 24, 1999
Sold by
Riley Michael P and Riley Susan F
Bought by
Smith Shari
Create a Home Valuation Report for This Property
The Home Valuation Report is an in-depth analysis detailing your home's value as well as a comparison with similar homes in the area
Home Values in the Area
Average Home Value in this Area
Purchase History
| Date | Buyer | Sale Price | Title Company |
|---|---|---|---|
| Diamond Garrett | $325,000 | -- | |
| Moen Thomas G | $302,500 | -- | |
| Discovery Bay Llc | $115,000 | -- | |
| Smith Shari | $142,000 | -- |
Source: Public Records
Mortgage History
| Date | Status | Borrower | Loan Amount |
|---|---|---|---|
| Open | Smith Shari | $320,681 | |
| Previous Owner | Smith Shari | $302,500 | |
| Previous Owner | Smith Shari | $71,000 |
Source: Public Records
Tax History Compared to Growth
Tax History
| Year | Tax Paid | Tax Assessment Tax Assessment Total Assessment is a certain percentage of the fair market value that is determined by local assessors to be the total taxable value of land and additions on the property. | Land | Improvement |
|---|---|---|---|---|
| 2025 | $10,426 | $232,820 | $102,900 | $129,920 |
| 2024 | $9,860 | $232,820 | $102,900 | $129,920 |
| 2023 | $9,527 | $232,820 | $102,900 | $129,920 |
| 2022 | $9,471 | $232,820 | $102,900 | $129,920 |
| 2021 | $8,831 | $208,180 | $102,900 | $105,280 |
| 2020 | $8,702 | $208,180 | $96,500 | $111,680 |
| 2019 | $8,702 | $208,180 | $96,460 | $111,720 |
| 2018 | $8,535 | $208,180 | $96,460 | $111,720 |
| 2017 | $8,544 | $208,180 | $96,460 | $111,720 |
| 2016 | $7,274 | $184,100 | $70,700 | $113,400 |
| 2015 | $7,053 | $184,100 | $70,700 | $113,400 |
| 2014 | $6,880 | $184,100 | $70,700 | $113,400 |
Source: Public Records
Map
Nearby Homes
- 37 W Normandy Dr
- 26 Berwyn Rd
- 56 Fox Chase Ln
- 47 Hillsboro Dr
- 269 Mountain Rd
- 41 Soby Dr
- 132 N Main St
- 183 Loomis Dr Unit 109
- 2 Arapahoe Rd Unit 313
- 2 Arapahoe Rd Unit 308
- 2 Arapahoe Rd Unit 611
- 2 Arapahoe Rd Unit 601
- 2 Arapahoe Rd Unit 510
- 2 Arapahoe Rd Unit 505
- 2 Arapahoe Rd Unit 604
- 2 Arapahoe Rd Unit 609
- 2 Arapahoe Rd Unit 607
- 2 Arapahoe Rd Unit 312
- 2 Arapahoe Rd Unit 603
- 2 Arapahoe Rd Unit 605