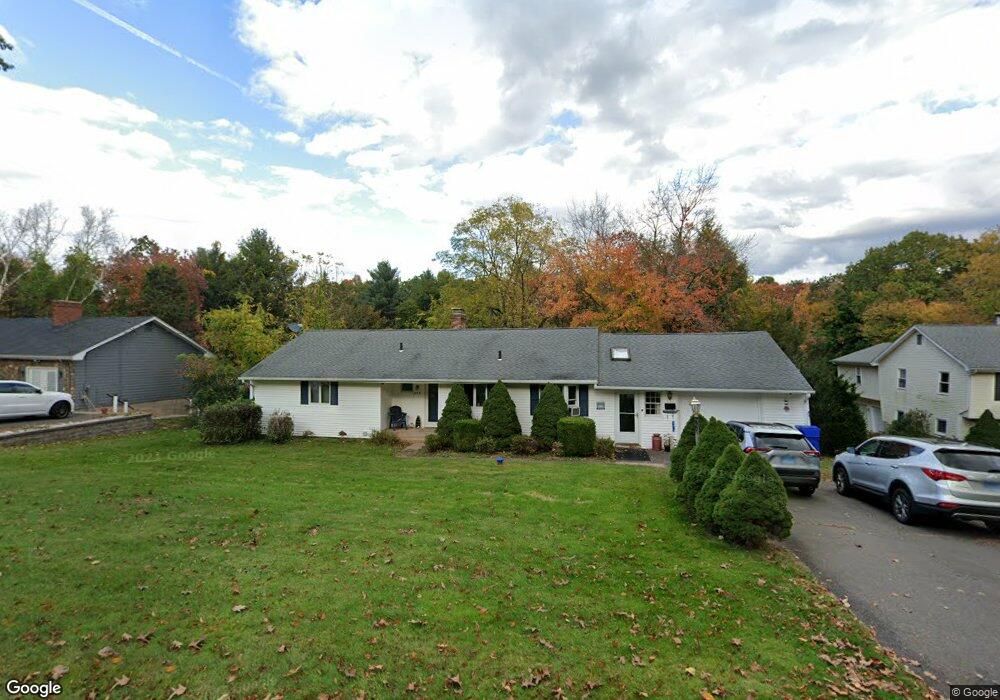
614 Foster St South Windsor, CT 06074
Estimated Value: $429,000 - $460,000
3
Beds
3
Baths
1,730
Sq Ft
$254/Sq Ft
Est. Value
About This Home
This home is located at 614 Foster St, South Windsor, CT 06074 and is currently estimated at $439,779, approximately $254 per square foot. 614 Foster St is a home located in Hartford County with nearby schools including Timothy Edwards School, South Windsor High School, and St Bridget School.
Ownership History
Date
Name
Owned For
Owner Type
Purchase Details
Closed on
Jan 27, 2011
Sold by
Jennie Susan L
Bought by
Dion Peter
Current Estimated Value
Home Financials for this Owner
Home Financials are based on the most recent Mortgage that was taken out on this home.
Original Mortgage
$224,169
Outstanding Balance
$154,047
Interest Rate
4.87%
Mortgage Type
FHA
Estimated Equity
$285,732
Purchase Details
Closed on
Nov 30, 2006
Sold by
Wagner Andrea
Bought by
Jennie Susan
Home Financials for this Owner
Home Financials are based on the most recent Mortgage that was taken out on this home.
Original Mortgage
$254,000
Interest Rate
6.36%
Purchase Details
Closed on
Mar 1, 2001
Sold by
Curtis Scott and Curtis Rebecca
Bought by
Pearson Matthew and Mergendahl Beth
Home Financials for this Owner
Home Financials are based on the most recent Mortgage that was taken out on this home.
Original Mortgage
$164,531
Interest Rate
7%
Create a Home Valuation Report for This Property
The Home Valuation Report is an in-depth analysis detailing your home's value as well as a comparison with similar homes in the area
Home Values in the Area
Average Home Value in this Area
Purchase History
| Date | Buyer | Sale Price | Title Company |
|---|---|---|---|
| Dion Peter | $230,000 | -- | |
| Jennie Susan | $289,000 | -- | |
| Pearson Matthew | $165,900 | -- |
Source: Public Records
Mortgage History
| Date | Status | Borrower | Loan Amount |
|---|---|---|---|
| Open | Pearson Matthew | $224,169 | |
| Previous Owner | Pearson Matthew | $254,000 | |
| Previous Owner | Pearson Matthew | $176,000 | |
| Previous Owner | Pearson Matthew | $164,531 |
Source: Public Records
Tax History Compared to Growth
Tax History
| Year | Tax Paid | Tax Assessment Tax Assessment Total Assessment is a certain percentage of the fair market value that is determined by local assessors to be the total taxable value of land and additions on the property. | Land | Improvement |
|---|---|---|---|---|
| 2024 | $7,709 | $223,700 | $106,700 | $117,000 |
| 2023 | $7,413 | $223,700 | $106,700 | $117,000 |
| 2022 | $6,668 | $172,000 | $105,300 | $66,700 |
| 2021 | $6,512 | $172,000 | $105,300 | $66,700 |
| 2020 | $6,515 | $172,000 | $105,300 | $66,700 |
| 2019 | $6,622 | $172,000 | $105,300 | $66,700 |
| 2018 | $6,479 | $172,000 | $105,300 | $66,700 |
| 2017 | $6,474 | $170,000 | $105,300 | $64,700 |
| 2016 | $6,348 | $170,000 | $105,300 | $64,700 |
| 2015 | $6,212 | $170,000 | $105,300 | $64,700 |
| 2014 | $6,037 | $170,000 | $105,300 | $64,700 |
Source: Public Records
Map
Nearby Homes
- 73 Beelzebub Rd
- 122 Greenwood Dr
- 175 Valley View Dr
- 835 Foster Street Extension
- 51 Carriage Dr
- 88 Andreis Trail
- 244 Carriage Dr
- 670 Avery St
- 140 Windshire Dr
- 909 Summer Hill Dr
- 16 Kelly Rd
- 11 Kupchunos Rd
- 1506 Summer Hill Dr Unit 1506
- 4 Alpine Dr
- 301 Summer Hill Dr
- 33 Oxford Dr
- 29 Wildwood Cir
- 25 Doria Ln
- 21 Berle Rd
- 56 Stedman Cir