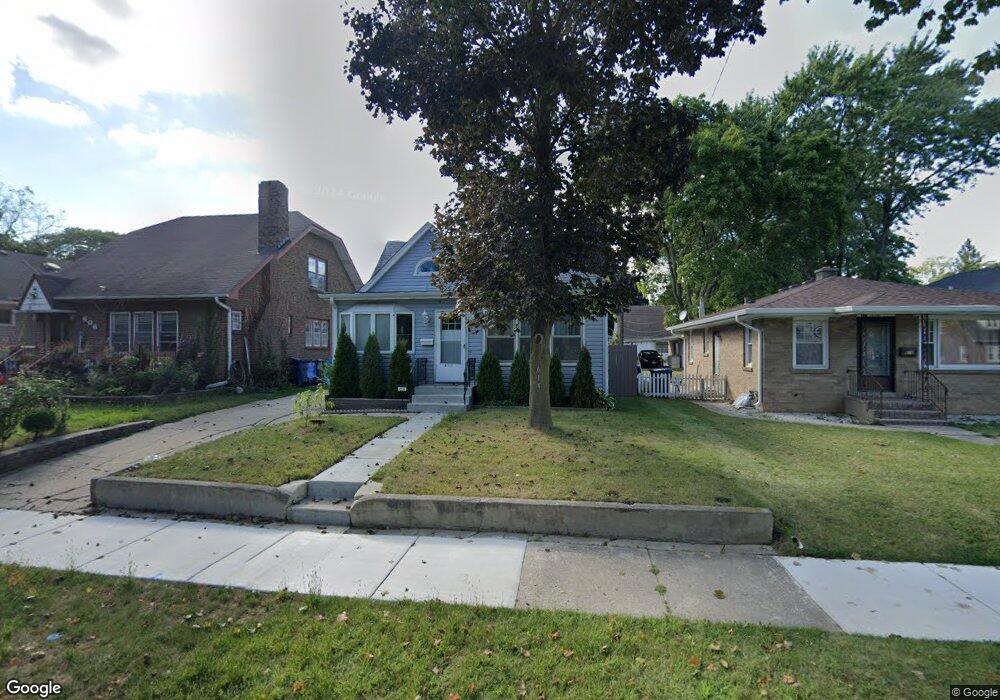
614 Judge Ave Waukegan, IL 60085
Lorraine Terrace NeighborhoodEstimated Value: $192,000 - $286,000
4
Beds
2
Baths
1,367
Sq Ft
$181/Sq Ft
Est. Value
About This Home
This home is located at 614 Judge Ave, Waukegan, IL 60085 and is currently estimated at $248,065, approximately $181 per square foot. 614 Judge Ave is a home located in Lake County with nearby schools including Hyde Park Elementary School, Miguel Juarez Middle School, and Waukegan High School.
Ownership History
Date
Name
Owned For
Owner Type
Purchase Details
Closed on
May 8, 2018
Sold by
Jimenez Marco A
Bought by
Bahena Rosa
Current Estimated Value
Purchase Details
Closed on
Sep 30, 2011
Sold by
Sanchez Arturo Ventura and Ventura Graciela R
Bought by
Jimenez Marco A
Home Financials for this Owner
Home Financials are based on the most recent Mortgage that was taken out on this home.
Original Mortgage
$73,098
Interest Rate
4.5%
Mortgage Type
FHA
Purchase Details
Closed on
Sep 15, 2005
Sold by
Lab Debra A and Preder John A
Bought by
Ventura Sanchez Arturo and Ventura Graciela R
Home Financials for this Owner
Home Financials are based on the most recent Mortgage that was taken out on this home.
Original Mortgage
$160,370
Interest Rate
5.8%
Mortgage Type
FHA
Purchase Details
Closed on
Dec 14, 1998
Sold by
Preder John A and Preder Rosemary
Bought by
Preder John A and Preder Rosemary
Create a Home Valuation Report for This Property
The Home Valuation Report is an in-depth analysis detailing your home's value as well as a comparison with similar homes in the area
Home Values in the Area
Average Home Value in this Area
Purchase History
| Date | Buyer | Sale Price | Title Company |
|---|---|---|---|
| Bahena Rosa | $116,450 | Greater Illinois Title Compa | |
| Jimenez Marco A | $75,000 | Affinity Title Services Llc | |
| Ventura Sanchez Arturo | $156,000 | Multiple | |
| Preder John A | -- | -- |
Source: Public Records
Mortgage History
| Date | Status | Borrower | Loan Amount |
|---|---|---|---|
| Previous Owner | Jimenez Marco A | $73,098 | |
| Previous Owner | Ventura Sanchez Arturo | $160,370 |
Source: Public Records
Tax History Compared to Growth
Tax History
| Year | Tax Paid | Tax Assessment Tax Assessment Total Assessment is a certain percentage of the fair market value that is determined by local assessors to be the total taxable value of land and additions on the property. | Land | Improvement |
|---|---|---|---|---|
| 2024 | $4,625 | $54,788 | $8,979 | $45,809 |
| 2023 | $4,235 | $49,052 | $8,039 | $41,013 |
| 2022 | $4,235 | $43,319 | $7,328 | $35,991 |
| 2021 | $4,068 | $39,018 | $6,902 | $32,116 |
| 2020 | $4,121 | $36,350 | $6,430 | $29,920 |
| 2019 | $4,147 | $33,309 | $5,892 | $27,417 |
| 2018 | $2,922 | $28,977 | $6,950 | $22,027 |
| 2017 | $2,793 | $25,637 | $6,149 | $19,488 |
| 2016 | $2,515 | $22,277 | $5,343 | $16,934 |
| 2015 | $2,354 | $19,938 | $4,782 | $15,156 |
| 2014 | $3,092 | $23,813 | $4,345 | $19,468 |
| 2012 | $3,053 | $25,798 | $4,707 | $21,091 |
Source: Public Records
Map
Nearby Homes
- 1213 Grand Ave
- 824 N Butrick St
- 2115 Lydia St
- 968 Judge Ave
- 1109 Massena Ave
- 615 Tiffany Dr
- 1005 N Lewis Ave
- 1000 Pine St
- 132 Dorchester Ct
- 1023 N Elmwood Ave
- 917 N Linden Ave
- 1038 Indiana Ave
- 1117 Judge Ave
- 1416 Hamilton Ct
- 511 Chestnut St
- 522 N Poplar St
- 620 N Poplar St
- 702 Franklin St
- 428 N Poplar St
- 1105 Woodlawn Cir
- 616 Judge Ave
- 606 Judge Ave
- 622 Judge Ave
- 604 Judge Ave
- 626 Judge Ave
- 602 Judge Ave
- 628 Judge Ave
- 611 Lorraine Ave
- 615 Lorraine Ave
- 607 Lorraine Ave
- 617 Lorraine Ave
- 603 Lorraine Ave
- 632 Judge Ave
- 542 Judge Ave
- 623 Lorraine Ave
- 615 Judge Ave
- 621 Judge Ave
- 607 Judge Ave
- 625 Lorraine Ave
- 540 Judge Ave