Estimated Value: $161,000 - $194,000
3
Beds
2
Baths
1,288
Sq Ft
$141/Sq Ft
Est. Value
About This Home
This home is located at 614 Maple St, Colon, MI 49040 and is currently estimated at $181,233, approximately $140 per square foot. 614 Maple St is a home located in St. Joseph County.
Ownership History
Date
Name
Owned For
Owner Type
Purchase Details
Closed on
Dec 22, 2021
Sold by
Carl Thornton
Bought by
Cross Donald J and Cross Laura L
Current Estimated Value
Purchase Details
Closed on
Mar 15, 2019
Sold by
Thornton Carl
Bought by
Cross Donald J and Cross Laura L
Purchase Details
Closed on
Apr 1, 2017
Sold by
Thornton Carl
Bought by
Cross Donald J and Cross Laura L
Purchase Details
Closed on
Aug 28, 2015
Sold by
Kaja Holdings 2 Llc
Bought by
Thorton Carl
Purchase Details
Closed on
Jul 16, 2012
Sold by
Oak Mortgage Llc
Bought by
Federal Home Loan Mortgage Corporation
Purchase Details
Closed on
Jul 12, 2012
Sold by
Jackson Jennifer J
Bought by
Oak Mortgage Llc
Purchase Details
Closed on
Jul 21, 2003
Sold by
Dennison Richard W and Dennison Robert
Bought by
Jackson Jennifer J
Purchase Details
Closed on
Aug 29, 2002
Sold by
Dennison Howard A and Dennison Lova M
Bought by
Dennison Richard W and Dennison Robert
Purchase Details
Closed on
Nov 26, 1998
Sold by
Dennison Richard W and Dennison Robert
Create a Home Valuation Report for This Property
The Home Valuation Report is an in-depth analysis detailing your home's value as well as a comparison with similar homes in the area
Purchase History
| Date | Buyer | Sale Price | Title Company |
|---|---|---|---|
| Cross Donald J | $50,130 | Deborah J Davis Law Pllc | |
| Cross Donald J | -- | None Available | |
| Cross Donald J | -- | Attorney | |
| Thorton Carl | $25,000 | None Available | |
| Federal Home Loan Mortgage Corporation | -- | None Available | |
| Oak Mortgage Llc | $61,277 | None Available | |
| Jackson Jennifer J | $65,000 | -- | |
| Dennison Richard W | -- | -- | |
| -- | -- | -- |
Source: Public Records
Mortgage History
| Date | Status | Borrower | Loan Amount |
|---|---|---|---|
| Closed | Cross Donald J | $0 |
Source: Public Records
Tax History
| Year | Tax Paid | Tax Assessment Tax Assessment Total Assessment is a certain percentage of the fair market value that is determined by local assessors to be the total taxable value of land and additions on the property. | Land | Improvement |
|---|---|---|---|---|
| 2025 | $863 | $65,000 | $13,500 | $51,500 |
| 2024 | $844 | $55,100 | $6,900 | $48,200 |
| 2023 | $920 | $51,100 | $6,900 | $44,200 |
| 2022 | $0 | $40,200 | $6,900 | $33,300 |
| 2021 | $0 | $37,900 | $6,900 | $31,000 |
| 2020 | $404 | $39,000 | $5,600 | $33,400 |
| 2019 | $309 | $32,800 | $5,600 | $27,200 |
| 2018 | $1,105 | $28,500 | $5,600 | $22,900 |
| 2017 | $1,579 | $29,200 | $29,200 | $0 |
| 2016 | -- | $28,200 | $28,200 | $0 |
| 2015 | -- | $27,400 | $0 | $0 |
| 2014 | -- | $28,000 | $28,000 | $0 |
| 2012 | -- | $23,000 | $23,000 | $0 |
Source: Public Records
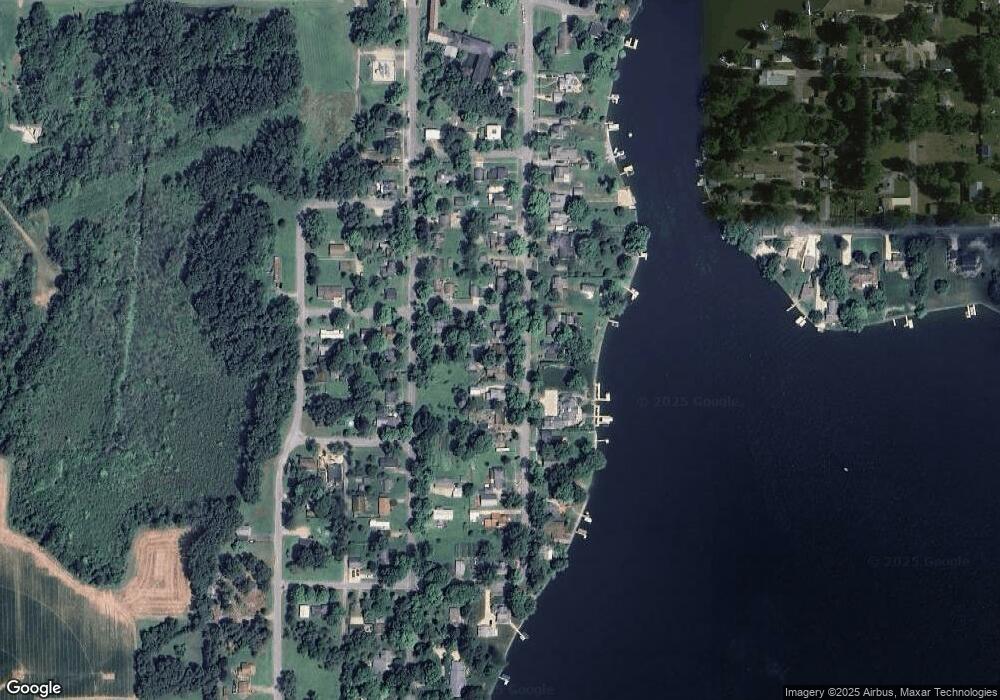
Map
Nearby Homes
- 622 Maple St
- 210 E South St
- VL Bowman St
- 917 Elm St
- 161 Palmer Ave
- 120 Palmer Ave
- 448 Long Lake Rd
- 309 N Blackstone Ave
- 407 Barry St
- 0 S Farrand Unit 25051538
- 58954 Lakeshore Dr
- 0 N Burr Oak Rd
- 31688 W Colon Rd
- 59178 Nora Dr
- 0 Coohon Rd
- 31908 Decker Rd
- 30725 Orla Engle Rd
- 30311 Michigan 86
- 55637 Bennett Rd
- 30315 Jacksonburg Rd
Your Personal Tour Guide
Ask me questions while you tour the home.