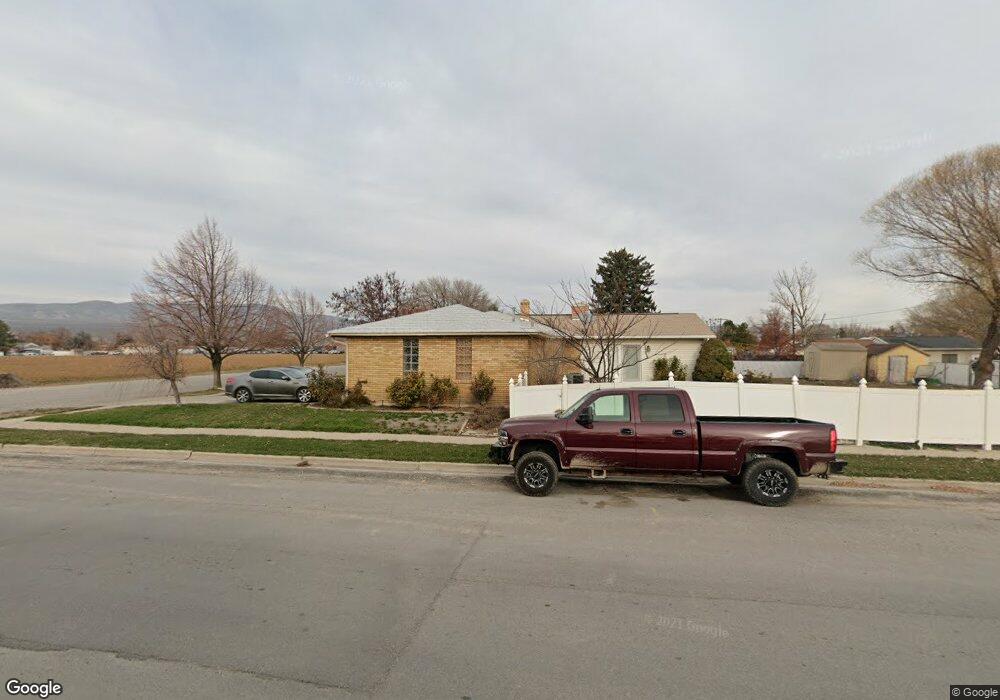
614 N 100 E Tremonton, UT 84337
Estimated Value: $396,000 - $435,000
Studio
--
Bath
2,196
Sq Ft
$188/Sq Ft
Est. Value
About This Home
This home is located at 614 N 100 E, Tremonton, UT 84337 and is currently estimated at $413,600, approximately $188 per square foot. 614 N 100 E is a home located in Box Elder County with nearby schools including North Park School, Bear River Middle School, and Alice C. Harris Intermediate School.
Ownership History
Date
Name
Owned For
Owner Type
Purchase Details
Closed on
Feb 6, 2024
Sold by
Fronk William
Bought by
Fronk William and Fronk Kristina
Current Estimated Value
Home Financials for this Owner
Home Financials are based on the most recent Mortgage that was taken out on this home.
Original Mortgage
$181,200
Outstanding Balance
$177,998
Interest Rate
6.61%
Mortgage Type
New Conventional
Estimated Equity
$235,602
Purchase Details
Closed on
Feb 5, 2024
Sold by
Fronk James Brent and Hess Patricia Ann
Bought by
Fronk William
Home Financials for this Owner
Home Financials are based on the most recent Mortgage that was taken out on this home.
Original Mortgage
$181,200
Outstanding Balance
$177,998
Interest Rate
6.61%
Mortgage Type
New Conventional
Estimated Equity
$235,602
Purchase Details
Closed on
Jan 13, 2016
Sold by
Fronk James Brent and Hess Patricia Ann
Bought by
Fronk Lawana S and The Lawana S Frank Revocable Trust
Create a Home Valuation Report for This Property
The Home Valuation Report is an in-depth analysis detailing your home's value as well as a comparison with similar homes in the area
Home Values in the Area
Average Home Value in this Area
Purchase History
| Date | Buyer | Sale Price | Title Company |
|---|---|---|---|
| Fronk William | -- | Intermountain Title | |
| Fronk William | -- | Intermountain Title | |
| Fronk William | -- | Intermountain Title | |
| Fronk Lawana S | -- | Intermountain Title Insuranc |
Source: Public Records
Mortgage History
| Date | Status | Borrower | Loan Amount |
|---|---|---|---|
| Open | Fronk William | $181,200 | |
| Closed | Fronk William | $181,200 |
Source: Public Records
Tax History
| Year | Tax Paid | Tax Assessment Tax Assessment Total Assessment is a certain percentage of the fair market value that is determined by local assessors to be the total taxable value of land and additions on the property. | Land | Improvement |
|---|---|---|---|---|
| 2025 | $2,511 | $390,770 | $105,000 | $285,770 |
| 2024 | $2,274 | $393,850 | $105,000 | $288,850 |
| 2023 | $2,431 | $413,289 | $100,000 | $313,289 |
| 2022 | $1,996 | $193,611 | $16,500 | $177,111 |
| 2021 | $1,866 | $233,532 | $30,000 | $203,532 |
| 2020 | $1,516 | $233,532 | $30,000 | $203,532 |
| 2019 | $1,406 | $115,564 | $16,500 | $99,064 |
| 2018 | $1,340 | $100,558 | $13,750 | $86,808 |
| 2017 | $1,384 | $182,833 | $13,750 | $157,833 |
| 2016 | $1,359 | $96,424 | $13,750 | $82,674 |
| 2015 | $1,229 | $88,909 | $13,750 | $75,159 |
| 2014 | $1,229 | $85,330 | $13,750 | $71,580 |
| 2013 | -- | $85,330 | $13,338 | $71,992 |
Source: Public Records
Map
Nearby Homes
- 524 N 100 E
- 384 N 200 E
- 785 N 200 E
- 278 N 870 E
- 278 N 870 E Unit 17
- 780 N 350 E
- 116 N Tremont St
- 117 N 100 W
- 960 N 100 W
- 708 N 600 W
- 978 N Tremont St
- 678 N 600 W Unit 103
- 672 N 600 W
- 768 N 600 W Unit 211
- 776 N 600 W Unit 210
- 776 N 600 W
- 711 N 600 W Unit 113
- 725 N 600 W Unit 111
- 719 N 600 W Unit 112
- 635 E 240 N Unit 9
Your Personal Tour Guide
Ask me questions while you tour the home.