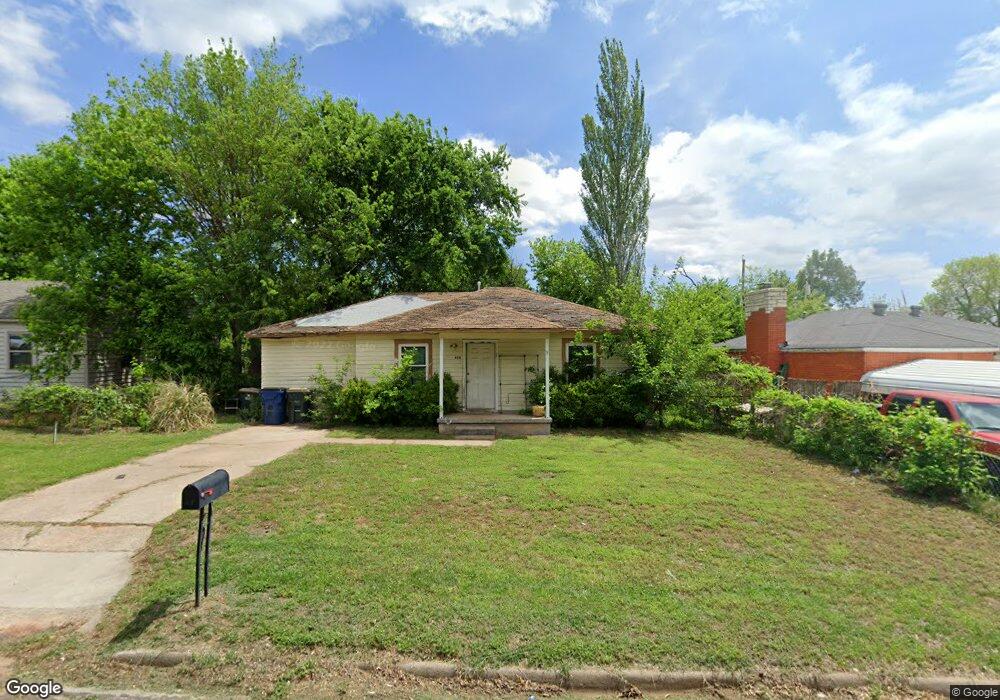
614 N H St Duncan, OK 73533
Estimated Value: $40,000 - $52,850
2
Beds
1
Bath
1,020
Sq Ft
$47/Sq Ft
Est. Value
About This Home
This home is located at 614 N H St, Duncan, OK 73533 and is currently estimated at $47,713, approximately $46 per square foot. 614 N H St is a home located in Stephens County with nearby schools including Woodrow Wilson Elementary School, Duncan Middle School, and Duncan High School.
Ownership History
Date
Name
Owned For
Owner Type
Purchase Details
Closed on
May 28, 2025
Sold by
Apfsdemm Inc
Bought by
Soup To Nuts Llc
Current Estimated Value
Purchase Details
Closed on
May 23, 2025
Sold by
Soup To Nuts Llc
Bought by
Jcp Muskogee Llc
Purchase Details
Closed on
May 20, 2016
Sold by
Blakenship Deeanna S
Bought by
Apfsdemn Inc
Purchase Details
Closed on
Nov 14, 2006
Sold by
Mcdaniel Ralph A and Mcdaniel Brenda
Bought by
Blankenship Deeanna S
Home Financials for this Owner
Home Financials are based on the most recent Mortgage that was taken out on this home.
Original Mortgage
$16,500
Interest Rate
6.26%
Mortgage Type
Purchase Money Mortgage
Purchase Details
Closed on
Sep 27, 2003
Sold by
Adams Lynette H
Purchase Details
Closed on
Aug 12, 1997
Sold by
Smith Lloyd and Smith Angela D
Purchase Details
Closed on
Sep 19, 1995
Sold by
Whitney-Hunt Inc
Create a Home Valuation Report for This Property
The Home Valuation Report is an in-depth analysis detailing your home's value as well as a comparison with similar homes in the area
Home Values in the Area
Average Home Value in this Area
Purchase History
| Date | Buyer | Sale Price | Title Company |
|---|---|---|---|
| Soup To Nuts Llc | $37,500 | Spartan Title | |
| Jcp Muskogee Llc | $41,000 | Spartan Title | |
| Apfsdemn Inc | $13,000 | None Available | |
| Blankenship Deeanna S | $16,500 | Stephens Co Abstract Co | |
| -- | $18,000 | -- | |
| -- | $13,000 | -- | |
| -- | $11,500 | -- |
Source: Public Records
Mortgage History
| Date | Status | Borrower | Loan Amount |
|---|---|---|---|
| Previous Owner | Blankenship Deeanna S | $16,500 |
Source: Public Records
Tax History Compared to Growth
Tax History
| Year | Tax Paid | Tax Assessment Tax Assessment Total Assessment is a certain percentage of the fair market value that is determined by local assessors to be the total taxable value of land and additions on the property. | Land | Improvement |
|---|---|---|---|---|
| 2025 | $183 | $2,256 | $493 | $1,763 |
| 2024 | $183 | $2,149 | $493 | $1,656 |
| 2023 | $183 | $2,149 | $493 | $1,656 |
| 2022 | $166 | $2,046 | $493 | $1,553 |
| 2021 | $165 | $1,949 | $493 | $1,456 |
| 2020 | $153 | $1,768 | $493 | $1,275 |
| 2019 | $146 | $1,684 | $493 | $1,191 |
| 2018 | $143 | $1,684 | $493 | $1,191 |
| 2017 | $131 | $1,527 | $493 | $1,034 |
| 2016 | $135 | $2,593 | $493 | $2,100 |
| 2015 | $114 | $2,518 | $493 | $2,025 |
| 2014 | $114 | $2,445 | $493 | $1,952 |
Source: Public Records
Map
Nearby Homes