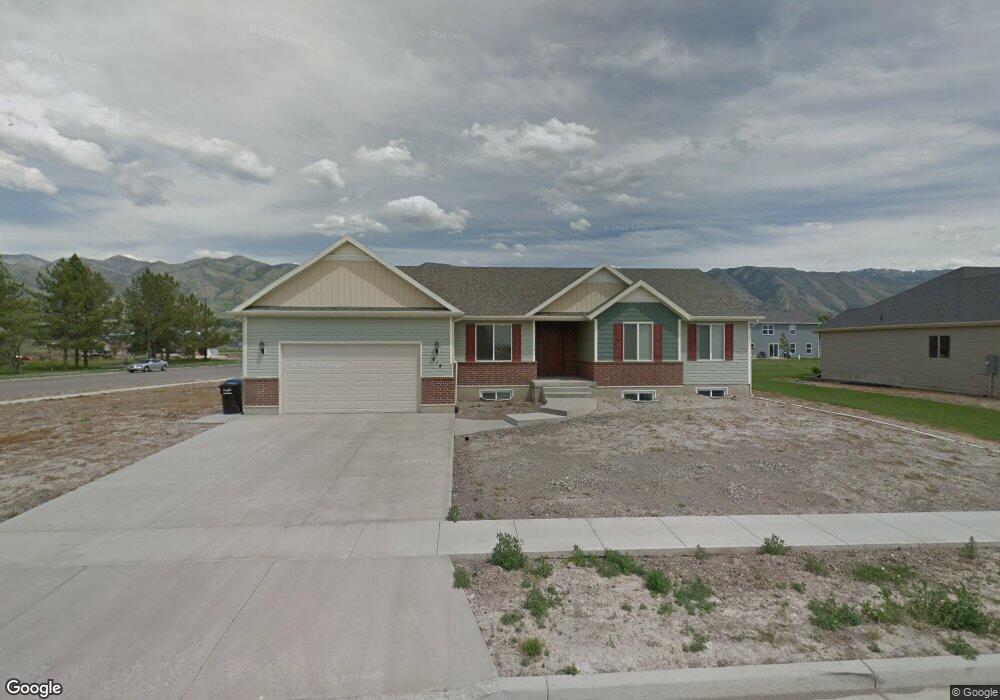
614 S 150 W Unit 6 Hyde Park, UT 84318
Estimated Value: $681,000 - $692,000
--
Bed
--
Bath
2,158
Sq Ft
$319/Sq Ft
Est. Value
About This Home
This home is located at 614 S 150 W Unit 6, Hyde Park, UT 84318 and is currently estimated at $687,987, approximately $318 per square foot. 614 S 150 W Unit 6 is a home located in Cache County with nearby schools including North Park School, Cedar Ridge School, and Cedar Ridge Middle School.
Ownership History
Date
Name
Owned For
Owner Type
Purchase Details
Closed on
Mar 19, 2018
Sold by
Johnson Kyle M and Johnson Catherine C
Bought by
Johnson Kyle M and Johnson Catherine C
Current Estimated Value
Purchase Details
Closed on
Jun 10, 2008
Sold by
Emerald Cove Development Llc
Bought by
Johnson Kyle M and Johnson Catherine C
Home Financials for this Owner
Home Financials are based on the most recent Mortgage that was taken out on this home.
Original Mortgage
$247,500
Interest Rate
6%
Mortgage Type
Purchase Money Mortgage
Purchase Details
Closed on
Mar 8, 2007
Sold by
Visionary Homes Llc
Bought by
Emerald Cove Development Llc
Create a Home Valuation Report for This Property
The Home Valuation Report is an in-depth analysis detailing your home's value as well as a comparison with similar homes in the area
Home Values in the Area
Average Home Value in this Area
Purchase History
| Date | Buyer | Sale Price | Title Company |
|---|---|---|---|
| Johnson Kyle M | -- | -- | |
| Johnson Kyle M | -- | Cache Title Company | |
| Emerald Cove Development Llc | -- | Cache Title Company |
Source: Public Records
Mortgage History
| Date | Status | Borrower | Loan Amount |
|---|---|---|---|
| Closed | Johnson Kyle M | $247,500 |
Source: Public Records
Tax History Compared to Growth
Tax History
| Year | Tax Paid | Tax Assessment Tax Assessment Total Assessment is a certain percentage of the fair market value that is determined by local assessors to be the total taxable value of land and additions on the property. | Land | Improvement |
|---|---|---|---|---|
| 2025 | $2,701 | $372,430 | $0 | $0 |
| 2024 | $3,214 | $408,595 | $0 | $0 |
| 2023 | $3,360 | $406,395 | $0 | $0 |
| 2022 | $35 | $406,395 | $0 | $0 |
| 2021 | $2,209 | $403,373 | $74,200 | $329,173 |
| 2020 | $2,075 | $360,438 | $74,200 | $286,238 |
| 2019 | $2,186 | $360,438 | $74,200 | $286,238 |
| 2018 | $1,924 | $310,920 | $55,350 | $255,570 |
| 2017 | $1,931 | $164,315 | $0 | $0 |
| 2016 | $1,959 | $138,810 | $0 | $0 |
| 2015 | $1,637 | $138,810 | $0 | $0 |
| 2014 | $1,596 | $138,810 | $0 | $0 |
| 2013 | -- | $139,255 | $0 | $0 |
Source: Public Records
Map
Nearby Homes
- 2700 N 300 E
- 2640 N Aspen Park Ln
- 2592 N 330 E
- 76 W 200 S
- 400 W 3100 N
- 290 E 450 S
- 2807 N Main St
- 164 E 200 S
- 667 E 2475 N Unit 8
- 623 E 2475 N Unit 5
- 645 E 2475 N Unit 6
- 651 E 2475 N Unit 7
- 721 E 2475 N Unit 12
- 679 E 2475 N Unit 9
- 685 E 2475 N
- 645 E 2475 N
- 709 E 2475 N Unit 11
- 667 E 2475 N
- 395 W 3200 N
- 400 W 3200 N
- 614 S 150 W
- 624 S 150 W Unit 7
- 624 S 150 W
- 617 S 100 W
- 609 S 150 W Unit 19
- 609 S 150 W
- 621 S 150 W Unit 18
- 634 S 150 W Unit 8
- 634 S 150 W
- 635 S 100 W Unit 4
- 141 W 600 S Unit 21
- 141 W 600 S
- 633 S 150 W Unit 17
- 633 S 150 W
- 587 S 100 W
- 644 S 150 W Unit 9
- 161 W 600 S Unit 20
- 161 W 600 S
- 674 S 150 W Unit 12
- 677 S 150 W Unit 15