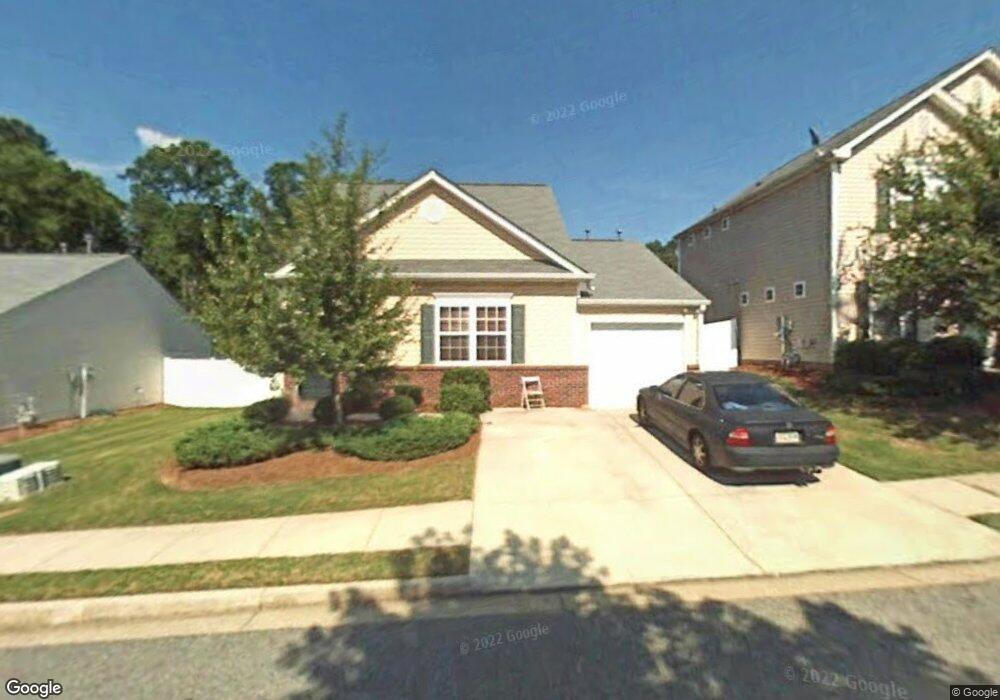
614 Spanish Oak Dr Unit 4 Acworth, GA 30102
Oak Grove NeighborhoodEstimated Value: $304,396 - $306,000
3
Beds
2
Baths
1,392
Sq Ft
$219/Sq Ft
Est. Value
About This Home
This home is located at 614 Spanish Oak Dr Unit 4, Acworth, GA 30102 and is currently estimated at $305,198, approximately $219 per square foot. 614 Spanish Oak Dr Unit 4 is a home located in Cherokee County with nearby schools including Oak Grove Elementary School, E. T. Booth Middle School, and Etowah High School.
Ownership History
Date
Name
Owned For
Owner Type
Purchase Details
Closed on
Feb 22, 2018
Sold by
Rhodes Myra Lindsey
Bought by
Rhodes James Warren and Rhodes Myra Lindsey
Current Estimated Value
Purchase Details
Closed on
Feb 24, 2006
Sold by
Rhodes James
Bought by
Rhodes M Lindsey
Purchase Details
Closed on
Jul 3, 2002
Sold by
Colony Homes Llc
Bought by
Rhodes James
Home Financials for this Owner
Home Financials are based on the most recent Mortgage that was taken out on this home.
Original Mortgage
$114,250
Interest Rate
6.79%
Mortgage Type
FHA
Create a Home Valuation Report for This Property
The Home Valuation Report is an in-depth analysis detailing your home's value as well as a comparison with similar homes in the area
Home Values in the Area
Average Home Value in this Area
Purchase History
| Date | Buyer | Sale Price | Title Company |
|---|---|---|---|
| Rhodes James Warren | -- | -- | |
| Rhodes M Lindsey | -- | -- | |
| Rhodes James | $116,100 | -- |
Source: Public Records
Mortgage History
| Date | Status | Borrower | Loan Amount |
|---|---|---|---|
| Previous Owner | Rhodes James | $114,250 |
Source: Public Records
Tax History Compared to Growth
Tax History
| Year | Tax Paid | Tax Assessment Tax Assessment Total Assessment is a certain percentage of the fair market value that is determined by local assessors to be the total taxable value of land and additions on the property. | Land | Improvement |
|---|---|---|---|---|
| 2025 | $3,358 | $127,888 | $21,600 | $106,288 |
| 2024 | $3,366 | $129,512 | $24,000 | $105,512 |
| 2023 | $3,293 | $126,736 | $24,000 | $102,736 |
| 2022 | $2,497 | $95,000 | $16,000 | $79,000 |
| 2021 | $2,281 | $80,344 | $16,000 | $64,344 |
| 2020 | $1,952 | $68,688 | $14,000 | $54,688 |
| 2019 | $1,798 | $63,280 | $12,800 | $50,480 |
| 2018 | $1,651 | $57,760 | $10,400 | $47,360 |
| 2017 | $1,536 | $140,900 | $10,400 | $45,960 |
| 2016 | $1,536 | $131,900 | $10,400 | $42,360 |
| 2015 | $1,379 | $117,300 | $9,200 | $37,720 |
| 2014 | $1,317 | $111,800 | $9,200 | $35,520 |
Source: Public Records
Map
Nearby Homes
- 423 Royal Oak Dr
- 626 Spanish Oak Dr
- 271 Oak Grove Way
- 402 Royal Oak Dr
- 4645 Highway 92
- 4915 Highway 92
- 4771 Highway 92
- 5574 Oak Grove Dr
- 1768 Balsa Ln
- 0 W Hwy 92 Unit 7354851
- 313 Maltibie Dr
- 100 Creekwood Trail
- 108 Creekwood Trail
- 400 Sable Trace Cove
- 6312 Woodstock Rd
- 577 Oakside Place
- 154 Bryon Ln
- 140 Bryon Ln
- 166 Woodhouse Cir
- 616 Spanish Oak Dr
- 612 Spanish Oak Dr
- 612 Spanish Oak Dr
- 612 Spanish Oak Dr Unit 4
- 612 Spanish Oak Dr Unit N/A
- 203 Oak Grove Ln
- 618 Spanish Oak Dr Unit 4
- 205 Oak Grove Ln
- 611 Spanish Oak Dr
- 615 Spanish Oak Dr Unit 4
- 609 Spanish Oak Dr
- 617 Spanish Oak Dr
- 620 Spanish Oak Dr Unit 76
- 620 Spanish Oak Dr Unit 4
- 207 Oak Grove Ln
- 610 Spanish Oak Dr
- 619 Spanish Oak Dr Unit 4
- 202 Oak Grove Ln Unit 6
- 622 Spanish Oak Dr
- 204 Oak Grove Ln Unit 6