Estimated Value: $171,000 - $219,000
3
Beds
2
Baths
1,880
Sq Ft
$101/Sq Ft
Est. Value
About This Home
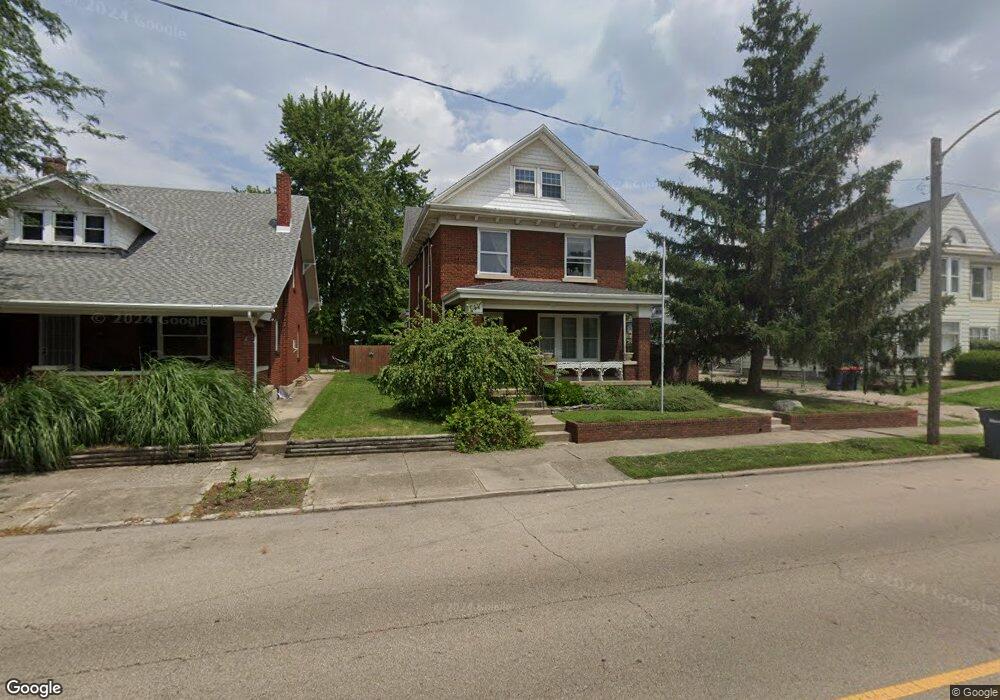
This home is located at 614 W High St, Piqua, OH 45356 and is currently estimated at $189,311, approximately $100 per square foot. 614 W High St is a home located in Miami County with nearby schools including Washington Primary School, Piqua Junior High School, and Piqua High School.
Ownership History
Date
Name
Owned For
Owner Type
Purchase Details
Closed on
Mar 2, 2023
Sold by
Bastian Jack R
Bought by
Bastian Saundra L
Current Estimated Value
Purchase Details
Closed on
Mar 17, 2009
Sold by
Bastian Saundra L
Bought by
Bastian Jack R and Bastian Saundra L
Purchase Details
Closed on
Sep 1, 1986
Bought by
Bastian Jack R
Create a Home Valuation Report for This Property
The Home Valuation Report is an in-depth analysis detailing your home's value as well as a comparison with similar homes in the area
Home Values in the Area
Average Home Value in this Area
Purchase History
| Date | Buyer | Sale Price | Title Company |
|---|---|---|---|
| Bastian Saundra L | -- | -- | |
| Bastian Jack R | -- | -- | |
| Bastian Jack R | -- | -- |
Source: Public Records
Tax History Compared to Growth
Tax History
| Year | Tax Paid | Tax Assessment Tax Assessment Total Assessment is a certain percentage of the fair market value that is determined by local assessors to be the total taxable value of land and additions on the property. | Land | Improvement |
|---|---|---|---|---|
| 2024 | $1,820 | $44,280 | $8,790 | $35,490 |
| 2023 | $1,820 | $44,280 | $8,790 | $35,490 |
| 2022 | $1,851 | $44,280 | $8,790 | $35,490 |
| 2021 | $1,557 | $34,060 | $6,760 | $27,300 |
| 2020 | $1,526 | $34,060 | $6,760 | $27,300 |
| 2019 | $1,574 | $34,060 | $6,760 | $27,300 |
| 2018 | $1,484 | $30,600 | $6,760 | $23,840 |
| 2017 | $1,502 | $30,600 | $6,760 | $23,840 |
| 2016 | $1,487 | $30,600 | $6,760 | $23,840 |
| 2015 | $1,463 | $29,440 | $6,510 | $22,930 |
| 2014 | $1,463 | $29,440 | $6,510 | $22,930 |
| 2013 | $1,468 | $29,440 | $6,510 | $22,930 |
Source: Public Records
Map
Nearby Homes