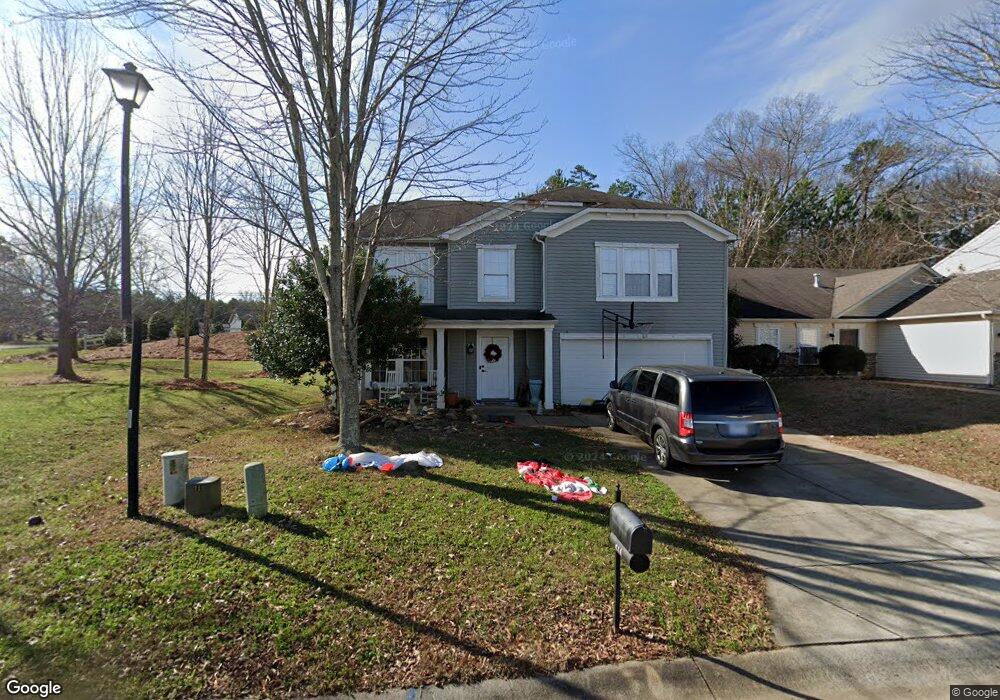
614 Winborne Ave SW Concord, NC 28025
Estimated Value: $350,000 - $368,000
3
Beds
3
Baths
2,842
Sq Ft
$126/Sq Ft
Est. Value
About This Home
This home is located at 614 Winborne Ave SW, Concord, NC 28025 and is currently estimated at $357,375, approximately $125 per square foot. 614 Winborne Ave SW is a home located in Cabarrus County with nearby schools including A.T. Allen Elementary School, C.C. Griffin Middle School, and Central Cabarrus High School.
Ownership History
Date
Name
Owned For
Owner Type
Purchase Details
Closed on
Nov 9, 2011
Sold by
M&W Industries Inc
Bought by
Castle Christopher D
Current Estimated Value
Home Financials for this Owner
Home Financials are based on the most recent Mortgage that was taken out on this home.
Original Mortgage
$124,755
Outstanding Balance
$85,481
Interest Rate
4.12%
Mortgage Type
FHA
Estimated Equity
$271,894
Purchase Details
Closed on
Aug 12, 2010
Sold by
Colonial National Mortgage
Bought by
M & W Industries Inc
Purchase Details
Closed on
Feb 2, 2010
Sold by
Haake Richard and Haake Carolyn K
Bought by
Colonial National Mortgage
Purchase Details
Closed on
Jul 19, 2005
Sold by
C P Morgan Communities Of Charlotte Llc
Bought by
Haake Richard
Home Financials for this Owner
Home Financials are based on the most recent Mortgage that was taken out on this home.
Original Mortgage
$25,100
Interest Rate
5.08%
Mortgage Type
Stand Alone Second
Create a Home Valuation Report for This Property
The Home Valuation Report is an in-depth analysis detailing your home's value as well as a comparison with similar homes in the area
Home Values in the Area
Average Home Value in this Area
Purchase History
| Date | Buyer | Sale Price | Title Company |
|---|---|---|---|
| Castle Christopher D | $128,000 | None Available | |
| M & W Industries Inc | $103,000 | None Available | |
| Colonial National Mortgage | $145,871 | None Available | |
| Haake Richard | $167,500 | -- |
Source: Public Records
Mortgage History
| Date | Status | Borrower | Loan Amount |
|---|---|---|---|
| Open | Castle Christopher D | $124,755 | |
| Previous Owner | Haake Richard | $25,100 | |
| Previous Owner | Haake Richard | $133,910 |
Source: Public Records
Tax History
| Year | Tax Paid | Tax Assessment Tax Assessment Total Assessment is a certain percentage of the fair market value that is determined by local assessors to be the total taxable value of land and additions on the property. | Land | Improvement |
|---|---|---|---|---|
| 2025 | $3,648 | $366,230 | $62,000 | $304,230 |
| 2024 | $3,648 | $366,230 | $62,000 | $304,230 |
| 2023 | $2,797 | $229,290 | $40,000 | $189,290 |
| 2022 | $2,797 | $229,290 | $40,000 | $189,290 |
| 2021 | $2,797 | $229,290 | $40,000 | $189,290 |
| 2020 | $2,797 | $229,290 | $40,000 | $189,290 |
| 2019 | $2,025 | $166,020 | $16,000 | $150,020 |
| 2018 | $1,992 | $166,020 | $16,000 | $150,020 |
| 2017 | $1,952 | $165,440 | $16,000 | $149,440 |
| 2016 | $1,158 | $158,340 | $16,800 | $141,540 |
| 2015 | $1,868 | $158,340 | $16,800 | $141,540 |
| 2014 | $1,868 | $158,340 | $16,800 | $141,540 |
Source: Public Records
Map
Nearby Homes
- 581 Winborne Ave SW
- 836 Chastain Ave
- 4194 Clifftonville Ave SW
- 1039 Manston Place SW
- 999 Ramsgate Dr SW
- 1040 Castle Rock Ct
- 3969 Potts Grove Place
- 618 Bloomover St
- 4410 Zion Church Rd
- 608 Nannyberry Ln
- 1009 Braxton Dr
- 630 Shellbark Dr
- 5016 Hildreth Ct
- 741 Nannyberry Ln
- 4003 Long Arrow Dr Unit 366
- 303 Olde North Church Dr Unit 38
- 4018 Bethesda Place
- 1562 Piney Church Rd
- 4227 Kiser Woods Dr SW
- 123 Softwind Ln
- 610 Winborne Ave SW
- 615 Piney Church Rd
- 606 Winborne Ave SW
- 602 Winborne Ave SW
- 704 Winborne Ave SW
- 596 Winborne Ave SW
- 4589 Kellybrook Dr
- 4593 Kellybrook Dr
- 708 Winborne Ave SW
- 4585 Kellybrook Dr
- 4592 Kellybrook Dr
- 602 Piney Church Rd
- 712 Winborne Ave SW
- 4581 Kellybrook Dr
- 541 Piney Church Rd
- 4588 Kellybrook Dr
- 716 Winborne Ave SW
- 716 Winborne Ave SW
- 716 Winborne Ave SW Unit 113
- 4584 Kellybrook Dr
Your Personal Tour Guide
Ask me questions while you tour the home.