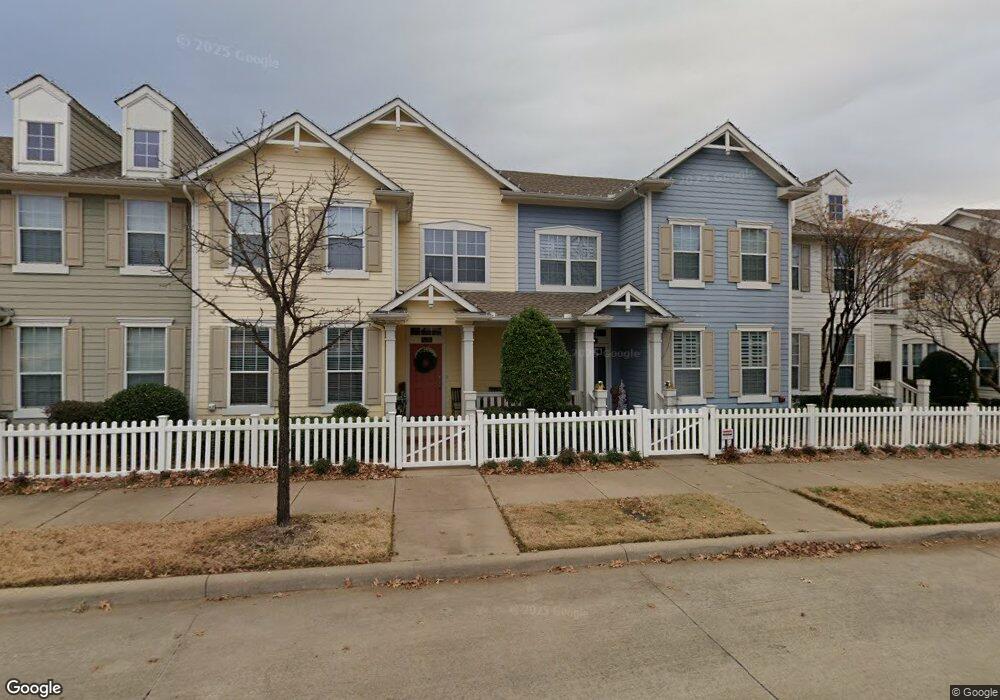
6140 Crescent St North Richland Hills, TX 76180
Estimated Value: $365,350 - $465,000
3
Beds
3
Baths
1,993
Sq Ft
$202/Sq Ft
Est. Value
About This Home
This home is located at 6140 Crescent St, North Richland Hills, TX 76180 and is currently estimated at $402,338, approximately $201 per square foot. 6140 Crescent St is a home located in Tarrant County with nearby schools including Walker Creek Elementary School, Smithfield Middle School, and Birdville High School.
Ownership History
Date
Name
Owned For
Owner Type
Purchase Details
Closed on
Jul 18, 2016
Sold by
Stallard Donna M
Bought by
Visage Michael Duane and Visage Carrie D Ann
Current Estimated Value
Home Financials for this Owner
Home Financials are based on the most recent Mortgage that was taken out on this home.
Original Mortgage
$172,400
Outstanding Balance
$137,538
Interest Rate
3.56%
Mortgage Type
New Conventional
Estimated Equity
$264,800
Purchase Details
Closed on
Jun 16, 2006
Sold by
Pasquinelli Portrait Homes Home Town Lp
Bought by
Stallard Donna M
Home Financials for this Owner
Home Financials are based on the most recent Mortgage that was taken out on this home.
Original Mortgage
$168,304
Interest Rate
7.25%
Mortgage Type
Fannie Mae Freddie Mac
Create a Home Valuation Report for This Property
The Home Valuation Report is an in-depth analysis detailing your home's value as well as a comparison with similar homes in the area
Home Values in the Area
Average Home Value in this Area
Purchase History
| Date | Buyer | Sale Price | Title Company |
|---|---|---|---|
| Visage Michael Duane | -- | Ort | |
| Stallard Donna M | -- | Ctic |
Source: Public Records
Mortgage History
| Date | Status | Borrower | Loan Amount |
|---|---|---|---|
| Open | Visage Michael Duane | $172,400 | |
| Previous Owner | Stallard Donna M | $168,304 |
Source: Public Records
Tax History Compared to Growth
Tax History
| Year | Tax Paid | Tax Assessment Tax Assessment Total Assessment is a certain percentage of the fair market value that is determined by local assessors to be the total taxable value of land and additions on the property. | Land | Improvement |
|---|---|---|---|---|
| 2025 | $5,756 | $328,000 | $60,000 | $268,000 |
| 2024 | $5,756 | $348,315 | $60,000 | $288,315 |
| 2023 | $7,296 | $359,410 | $60,000 | $299,410 |
| 2022 | $7,276 | $309,533 | $40,000 | $269,533 |
| 2021 | $6,995 | $276,559 | $40,000 | $236,559 |
| 2020 | $6,359 | $249,900 | $40,000 | $209,900 |
| 2019 | $6,581 | $249,900 | $40,000 | $209,900 |
| 2018 | $6,188 | $235,000 | $40,000 | $195,000 |
| 2017 | $5,892 | $218,990 | $30,000 | $188,990 |
| 2016 | $4,931 | $199,618 | $30,000 | $169,618 |
| 2015 | $3,424 | $166,600 | $30,000 | $136,600 |
| 2014 | $3,424 | $166,600 | $30,000 | $136,600 |
Source: Public Records
Map
Nearby Homes
- 8020 Bridge St
- 8057 Caladium Dr
- 6017 Avalon St
- 5920 Pedernales Ridge
- 8240 Bridge St
- 6113 Cliffbrook Dr
- 6250 Shirley Dr
- 7713 Deaver Dr
- 0 Mid Cities Blvd
- 7704 Terry Dr
- 7457 N College Cir
- 7696 Resting Mews Ln
- 7717 Reis Ln
- 7632 Terry Dr
- 7800 Mockingbird Ln Unit 29
- 7800 Mockingbird Ln Unit 81
- 7800 Mockingbird Ln Unit 73
- 7800 Mockingbird Ln Unit 43
- 7800 Mockingbird Ln Unit 205
- 8321 Bridge St
- 6144 Crescent St
- 6132 Crescent St
- 6136 Crescent St
- 6148 Crescent St
- 6152 Crescent St
- 6128 Crescent St
- 6124 Crescent St
- 7901 Mimosa Dr
- 6120 Crescent St
- 8000 Bridge St
- 7905 Mimosa Dr
- 8004 Bridge St
- 6200 Crescent St
- 6204 Crescent St
- 7909 Mimosa Dr
- 8008 Bridge St
- 6208 Crescent St
- 8001 Mimosa Dr
- 6212 Crescent St
- 8005 Mimosa Dr