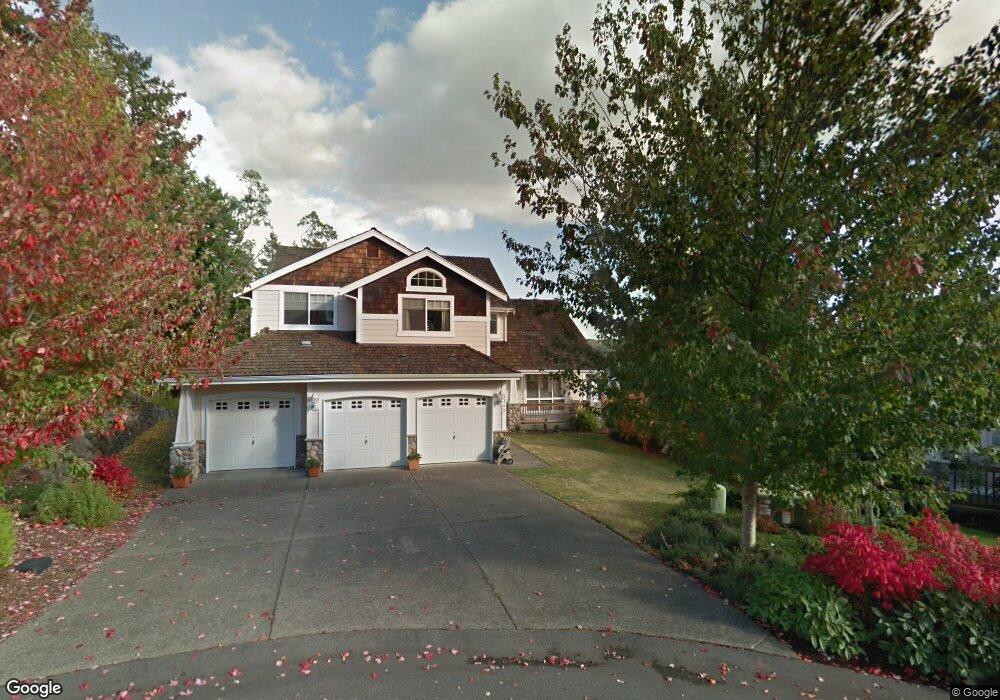
6142 Regatta Place NE Bremerton, WA 98311
Estimated Value: $673,000 - $739,000
4
Beds
3
Baths
2,768
Sq Ft
$256/Sq Ft
Est. Value
About This Home
This home is located at 6142 Regatta Place NE, Bremerton, WA 98311 and is currently estimated at $708,931, approximately $256 per square foot. 6142 Regatta Place NE is a home located in Kitsap County with nearby schools including View Ridge Elementary School, Mountain View Middle School, and Bremerton High School.
Ownership History
Date
Name
Owned For
Owner Type
Purchase Details
Closed on
May 18, 2020
Sold by
Morritt Shelley B
Bought by
Gran Shelley B Morritt and Gran Calvin M
Current Estimated Value
Purchase Details
Closed on
Jun 25, 2004
Sold by
Conrad Keith A and Morritt Shelley B
Bought by
Morritt Shelley B
Home Financials for this Owner
Home Financials are based on the most recent Mortgage that was taken out on this home.
Original Mortgage
$284,000
Outstanding Balance
$137,495
Interest Rate
5.75%
Mortgage Type
New Conventional
Estimated Equity
$571,436
Purchase Details
Closed on
Jun 22, 2001
Sold by
Capstone Homes Inc
Bought by
Conrad Keith A and Conrad Shelley B
Home Financials for this Owner
Home Financials are based on the most recent Mortgage that was taken out on this home.
Original Mortgage
$256,234
Interest Rate
7.15%
Create a Home Valuation Report for This Property
The Home Valuation Report is an in-depth analysis detailing your home's value as well as a comparison with similar homes in the area
Home Values in the Area
Average Home Value in this Area
Purchase History
| Date | Buyer | Sale Price | Title Company |
|---|---|---|---|
| Gran Shelley B Morritt | -- | Accommodation | |
| Morritt Shelley B | -- | Stewart Title Of Kitsap | |
| Conrad Keith A | $269,720 | Transnation Title Insurance |
Source: Public Records
Mortgage History
| Date | Status | Borrower | Loan Amount |
|---|---|---|---|
| Open | Morritt Shelley B | $284,000 | |
| Closed | Conrad Keith A | $256,234 |
Source: Public Records
Tax History Compared to Growth
Tax History
| Year | Tax Paid | Tax Assessment Tax Assessment Total Assessment is a certain percentage of the fair market value that is determined by local assessors to be the total taxable value of land and additions on the property. | Land | Improvement |
|---|---|---|---|---|
| 2026 | $6,274 | $641,200 | $132,270 | $508,930 |
| 2025 | $6,274 | $641,200 | $132,270 | $508,930 |
| 2024 | $6,060 | $641,200 | $132,270 | $508,930 |
| 2023 | $6,079 | $641,200 | $132,270 | $508,930 |
| 2022 | $5,689 | $530,820 | $109,310 | $421,510 |
| 2021 | $5,545 | $485,880 | $76,720 | $409,160 |
| 2020 | $5,111 | $462,840 | $75,220 | $387,620 |
| 2019 | $4,908 | $441,590 | $72,210 | $369,380 |
| 2018 | $5,677 | $385,690 | $59,680 | $326,010 |
| 2017 | $5,141 | $385,690 | $59,680 | $326,010 |
| 2016 | $4,866 | $346,390 | $53,280 | $293,110 |
| 2015 | $4,820 | $351,540 | $59,030 | $292,510 |
| 2014 | -- | $333,260 | $59,030 | $274,230 |
| 2013 | -- | $333,260 | $59,030 | $274,230 |
Source: Public Records
Map
Nearby Homes
- 3532 NE Shore Cliff St
- 6305 Rest Place NE
- 3840 NE Ambleside Ln
- 3744 NE Trout Brook Ln
- 3 Illahee Rd NE
- 5503 Fern Ave NE
- 3703 NE Trout Brook Ln
- 3709 NE Liverpool Dr
- 3060 NE Mcwilliams Rd Unit 104
- 3060 NE Mcwilliams Rd Unit 9
- 3060 NE Mcwilliams Rd Unit 124
- 5208 Illahee Rd NE
- 2940 Osiris Ct NE
- 0 University Point Cir NE
- 7550 Varsity Ln NE
- 6371 Illahee Rd NE
- 7265 Thasos Ave NE
- 2348 NE Windsor Ct
- 3000 NE Loyola St
- 3467 Partridge Hollow NE
- 6148 Regatta Place NE
- 3562 NE Shore Cliff St
- 6136 Regatta Place NE
- 6145 Regatta Place NE
- 3550 NE Shore Cliff St
- 6130 Regatta Place NE
- 6139 Regatta Place NE
- 6133 Regatta Place NE
- 3544 NE Shore Cliff St
- 6193 Oceanside Place NE
- 6124 Regatta Place NE
- 3551 NE Shore Cliff St
- 6349 Illahee Rd NE
- 6351 Illahee Rd NE
- 6127 Regatta Place NE
- 3124 NE Seahurst Ct
- 6200 Oceanside Place NE
- 6187 Oceanside Place NE
- 6341 Illahee Rd NE