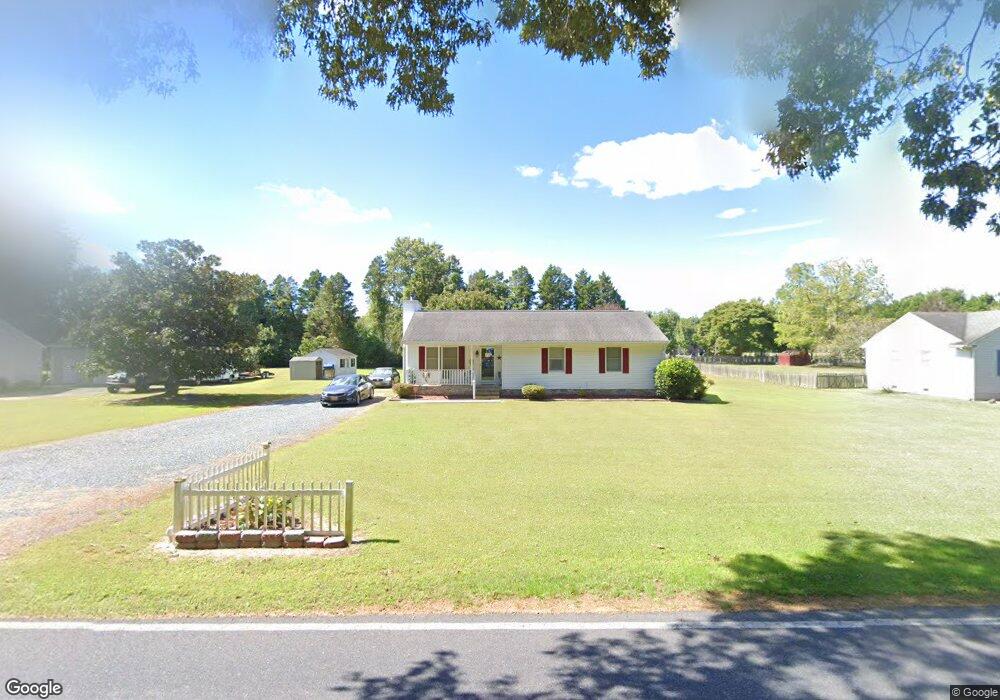
6146 Rockawalkin Rd Salisbury, MD 21801
South Salisbury NeighborhoodEstimated Value: $223,000 - $295,000
3
Beds
2
Baths
1,272
Sq Ft
$212/Sq Ft
Est. Value
About This Home
This home is located at 6146 Rockawalkin Rd, Salisbury, MD 21801 and is currently estimated at $270,291, approximately $212 per square foot. 6146 Rockawalkin Rd is a home located in Wicomico County with nearby schools including Westside Primary School, Westside Intermediate School, and Salisbury Middle School.
Ownership History
Date
Name
Owned For
Owner Type
Purchase Details
Closed on
Jun 14, 2017
Sold by
Hempfield Benjamin L and Hempfield Theresa M
Bought by
Hempfield Theresa M
Current Estimated Value
Purchase Details
Closed on
Jul 31, 2015
Sold by
Doster Frederick S
Bought by
Hempfield Benjamin L and Hempfield Theresa M
Home Financials for this Owner
Home Financials are based on the most recent Mortgage that was taken out on this home.
Original Mortgage
$152,203
Outstanding Balance
$119,910
Interest Rate
4.08%
Mortgage Type
VA
Estimated Equity
$150,381
Purchase Details
Closed on
May 25, 2004
Sold by
White Kimberly P
Bought by
Doster Frederick S
Purchase Details
Closed on
Mar 8, 2000
Sold by
Marshall Lisa C
Bought by
White Kimberly P and White George R
Purchase Details
Closed on
Aug 6, 1990
Sold by
Tiso Gustav K and Tiso Maria R
Bought by
Marshall Lisa C
Home Financials for this Owner
Home Financials are based on the most recent Mortgage that was taken out on this home.
Original Mortgage
$78,600
Interest Rate
9.84%
Create a Home Valuation Report for This Property
The Home Valuation Report is an in-depth analysis detailing your home's value as well as a comparison with similar homes in the area
Home Values in the Area
Average Home Value in this Area
Purchase History
| Date | Buyer | Sale Price | Title Company |
|---|---|---|---|
| Hempfield Theresa M | -- | None Available | |
| Hempfield Benjamin L | $149,000 | Coastal Title & Escrow | |
| Doster Frederick S | $134,000 | -- | |
| White Kimberly P | $93,500 | -- | |
| Marshall Lisa C | $76,900 | -- |
Source: Public Records
Mortgage History
| Date | Status | Borrower | Loan Amount |
|---|---|---|---|
| Open | Hempfield Benjamin L | $152,203 | |
| Previous Owner | Marshall Lisa C | $78,600 | |
| Closed | White Kimberly P | -- |
Source: Public Records
Tax History Compared to Growth
Tax History
| Year | Tax Paid | Tax Assessment Tax Assessment Total Assessment is a certain percentage of the fair market value that is determined by local assessors to be the total taxable value of land and additions on the property. | Land | Improvement |
|---|---|---|---|---|
| 2025 | $1,632 | $189,367 | $0 | $0 |
| 2024 | $1,632 | $172,333 | $0 | $0 |
| 2023 | $1,595 | $155,300 | $39,800 | $115,500 |
| 2022 | $1,643 | $155,300 | $39,800 | $115,500 |
| 2021 | $1,586 | $155,300 | $39,800 | $115,500 |
| 2020 | $1,586 | $169,100 | $35,800 | $133,300 |
| 2019 | $1,527 | $154,667 | $0 | $0 |
| 2018 | $1,456 | $140,233 | $0 | $0 |
| 2017 | $1,383 | $125,800 | $0 | $0 |
| 2016 | -- | $124,500 | $0 | $0 |
| 2015 | $1,322 | $123,200 | $0 | $0 |
| 2014 | $1,322 | $121,900 | $0 | $0 |
Source: Public Records
Map
Nearby Homes
- 6209 Rockawalkin Rd
- 6229 Ayrshire Dr
- 6151 Trails End Ct
- 26924 Black Horse Run
- 6177 Ayrshire Dr
- 6058 Gloucester Ct
- 26882 Pratt Rd
- 5991 Hounds Bay Cir
- 5973 Smithys Ln
- 27124 Patriot Dr
- 5709 Royal Mile Blvd
- 5686 N Nithsdale Dr Unit N
- 5703 Royal Mile Blvd
- 5688 Kirkpatrick Ct
- 0 King Stuart Dr Unit MDWC2018516
- 26694 Pemberton Dr
- 6061 Bridle Ct
- 5541 E Nithsdale Dr
- 27640 Belgian Way
- 27620 Appaloosa Dr
- 6156 Rockawalkin Rd
- 6136 Rockawalkin Rd
- 6125 Rockawalkin Rd
- 6120 Rockawalkin Rd
- 6149 Rockawalkin Rd
- 6262 Ayrshire Dr
- 6256 Ayrshire Dr
- 6268 Ayrshire Dr
- 6159 Rockawalkin Rd
- 6250 Ayrshire Dr
- 6104 Rockawalkin Rd
- 6169 Rockawalkin Rd
- 6274 Ayrshire Dr
- 6188 Rockawalkin Rd
- 6097 Rockawalkin Rd
- 6096 Rockawalkin Rd
- 6259 Ayrshire Dr
- 6253 Ayrshire Dr
- 6181 Rockawalkin Rd
- 6265 Ayrshire Dr