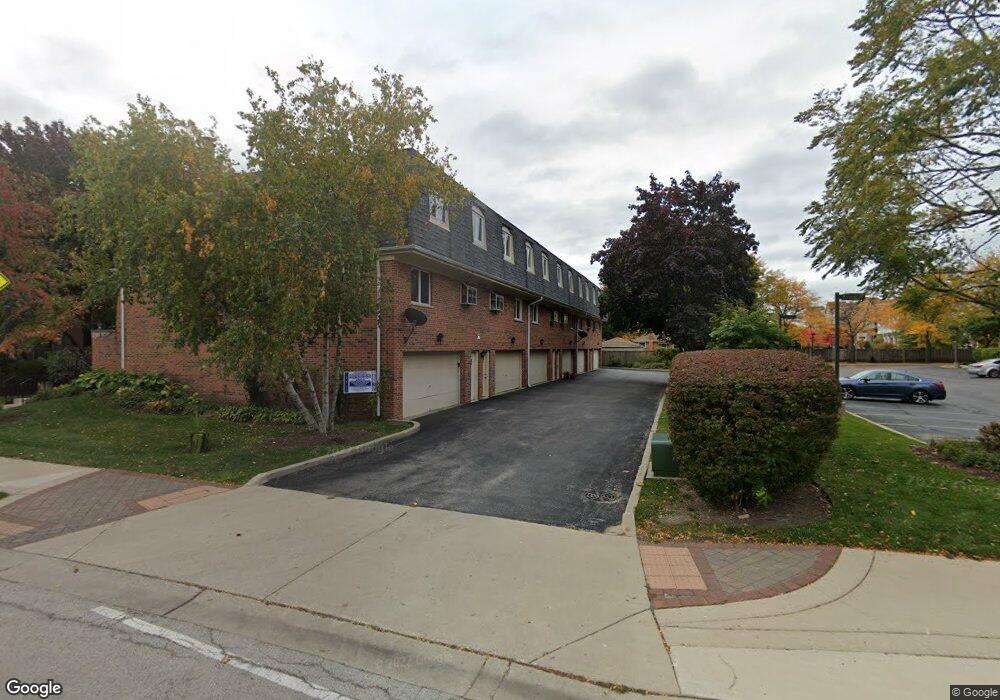
6147 Lincoln Ave Unit 1E Morton Grove, IL 60053
Estimated Value: $352,695 - $482,000
3
Beds
--
Bath
1,814
Sq Ft
$217/Sq Ft
Est. Value
About This Home
This home is located at 6147 Lincoln Ave Unit 1E, Morton Grove, IL 60053 and is currently estimated at $393,674, approximately $217 per square foot. 6147 Lincoln Ave Unit 1E is a home located in Cook County with nearby schools including Park View Elementary School and Niles West High School.
Ownership History
Date
Name
Owned For
Owner Type
Purchase Details
Closed on
Jun 27, 2001
Sold by
Goldin Michael and Goldin Larias
Bought by
Lasalle Bank National Assn and Trust #127778
Current Estimated Value
Home Financials for this Owner
Home Financials are based on the most recent Mortgage that was taken out on this home.
Original Mortgage
$248,000
Interest Rate
7.18%
Purchase Details
Closed on
Jun 26, 2001
Sold by
Khanin Lew and Khanin Nina
Bought by
Goldin Michael and Goldin Larisa
Home Financials for this Owner
Home Financials are based on the most recent Mortgage that was taken out on this home.
Original Mortgage
$248,000
Interest Rate
7.18%
Purchase Details
Closed on
Jul 23, 1993
Sold by
Fahy Bernadette M
Bought by
Khanin Lew A and Khanin Nina
Home Financials for this Owner
Home Financials are based on the most recent Mortgage that was taken out on this home.
Original Mortgage
$150,300
Interest Rate
7.28%
Create a Home Valuation Report for This Property
The Home Valuation Report is an in-depth analysis detailing your home's value as well as a comparison with similar homes in the area
Home Values in the Area
Average Home Value in this Area
Purchase History
| Date | Buyer | Sale Price | Title Company |
|---|---|---|---|
| Lasalle Bank National Assn | -- | -- | |
| Goldin Michael | $310,000 | Chicago Title Insurance Co | |
| Khanin Lew A | -- | -- |
Source: Public Records
Mortgage History
| Date | Status | Borrower | Loan Amount |
|---|---|---|---|
| Closed | Goldin Michael | $248,000 | |
| Previous Owner | Khanin Lew A | $150,300 |
Source: Public Records
Tax History Compared to Growth
Tax History
| Year | Tax Paid | Tax Assessment Tax Assessment Total Assessment is a certain percentage of the fair market value that is determined by local assessors to be the total taxable value of land and additions on the property. | Land | Improvement |
|---|---|---|---|---|
| 2024 | $8,564 | $29,649 | $3,540 | $26,109 |
| 2023 | $8,159 | $29,649 | $3,540 | $26,109 |
| 2022 | $8,159 | $29,649 | $3,540 | $26,109 |
| 2021 | $7,696 | $23,994 | $2,178 | $21,816 |
| 2020 | $7,491 | $23,994 | $2,178 | $21,816 |
| 2019 | $7,508 | $26,815 | $2,178 | $24,637 |
| 2018 | $6,858 | $21,733 | $1,974 | $19,759 |
| 2017 | $6,909 | $21,733 | $1,974 | $19,759 |
| 2016 | $7,611 | $25,400 | $1,974 | $23,426 |
| 2015 | $7,856 | $24,380 | $1,702 | $22,678 |
| 2014 | $7,848 | $24,380 | $1,702 | $22,678 |
| 2013 | $7,669 | $24,380 | $1,702 | $22,678 |
Source: Public Records
Map
Nearby Homes
- 6140 Elm St
- 6166 Mayfair St Unit 33714
- 8425 Callie Ave Unit 62
- 6163 Mayfair St Unit 102714
- 6035 Lincoln Ave
- 8400 Callie Ave Unit D209
- 8400 Callie Ave Unit D207
- 8300 Callie Ave Unit F314
- 8300 Callie Ave Unit F610
- 6020 Lincoln Ave Unit 407
- 6330 Lincoln Ave Unit 2A
- 6411 Elm St
- 8380 Miami Ave
- 8712 Ferris Ave
- 6330 Hennings Ct
- 6338 Hennings Ct
- 6332 Hennings Ct
- 6336 Hennings Ct
- 6334 Hennings Ct
- 6340 Hennings Ct
- 6147 Lincoln Ave Unit 1A
- 6147 Lincoln Ave Unit 1B
- 6147 Lincoln Ave Unit 1C
- 6147 Lincoln Ave Unit 1D
- 6147 Lincoln Ave Unit 1F
- 6147 Lincoln Ave Unit F
- 6147 Lincoln Ave Unit A
- 6147 Lincoln Ave Unit D
- 6145 Lincoln Ave Unit B
- 6145 Lincoln Ave Unit 5W
- 6145 Lincoln Ave Unit 3W
- 6145 Lincoln Ave Unit 1W
- 6145 Lincoln Ave Unit 2W
- 6145 Lincoln Ave Unit 4W
- 6145 Lincoln Ave Unit C
- 6145 Lincoln Ave Unit D
- 6145 Lincoln Ave Unit 4D
- 6145 Lincoln Ave Unit E
- 6145 Lincoln Ave
- 6143 Lincoln Ave Unit B