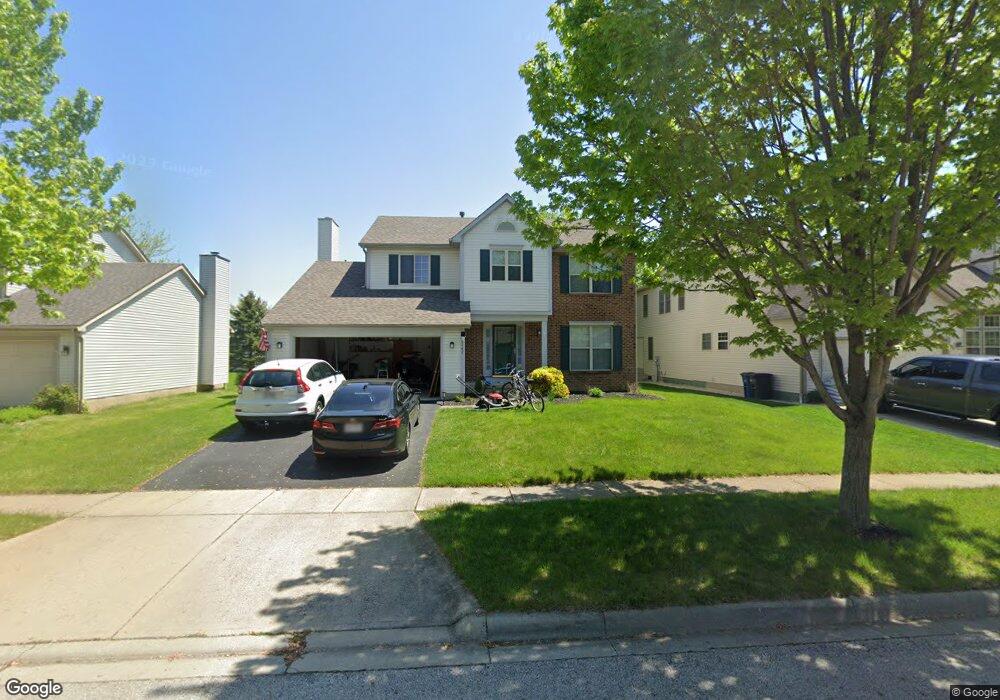
6147 Northcliff Blvd Dublin, OH 43016
Estimated Value: $456,000 - $501,270
4
Beds
3
Baths
2,095
Sq Ft
$231/Sq Ft
Est. Value
About This Home
This home is located at 6147 Northcliff Blvd, Dublin, OH 43016 and is currently estimated at $484,068, approximately $231 per square foot. 6147 Northcliff Blvd is a home located in Franklin County with nearby schools including Indian Run Elementary School, John Sells Middle School, and Dublin Coffman High School.
Ownership History
Date
Name
Owned For
Owner Type
Purchase Details
Closed on
Jun 28, 2025
Sold by
Eiterman Carla
Bought by
Eiterman Eric
Current Estimated Value
Purchase Details
Closed on
Apr 6, 2021
Sold by
Holdrieth Mary J and Philip D Holdrieth Trust
Bought by
Eiterman Eric and Dunbar Sabrina
Purchase Details
Closed on
Nov 2, 2018
Bought by
Holdrieth Mary J Tr
Purchase Details
Closed on
Aug 26, 2005
Sold by
Holdrieth Phillip and Holdrieth Mary J
Bought by
Holdrieth Philip D and Philip D Holdrieth Trust
Purchase Details
Closed on
Nov 27, 2002
Sold by
Hudock Jacqueline A and Hudock Anthony J
Bought by
Holdrieth Philip D
Purchase Details
Closed on
Aug 22, 1997
Sold by
Borror Corporation
Bought by
Hudock Anthony J and Hudock Jacqueline A
Home Financials for this Owner
Home Financials are based on the most recent Mortgage that was taken out on this home.
Original Mortgage
$159,150
Interest Rate
7.57%
Mortgage Type
Balloon
Create a Home Valuation Report for This Property
The Home Valuation Report is an in-depth analysis detailing your home's value as well as a comparison with similar homes in the area
Home Values in the Area
Average Home Value in this Area
Purchase History
| Date | Buyer | Sale Price | Title Company |
|---|---|---|---|
| Eiterman Eric | -- | None Listed On Document | |
| Eiterman Eric | $335,000 | Crown Search Services Ltd | |
| Holdrieth Mary J Tr | -- | -- | |
| Holdrieth Philip D | -- | -- | |
| Holdrieth Philip D | $207,000 | Chicago Title | |
| Hudock Anthony J | $181,500 | Alliance Title |
Source: Public Records
Mortgage History
| Date | Status | Borrower | Loan Amount |
|---|---|---|---|
| Previous Owner | Hudock Anthony J | $159,150 |
Source: Public Records
Tax History Compared to Growth
Tax History
| Year | Tax Paid | Tax Assessment Tax Assessment Total Assessment is a certain percentage of the fair market value that is determined by local assessors to be the total taxable value of land and additions on the property. | Land | Improvement |
|---|---|---|---|---|
| 2024 | $9,221 | $141,930 | $36,440 | $105,490 |
| 2023 | $9,093 | $141,925 | $36,435 | $105,490 |
| 2022 | $7,375 | $105,220 | $25,590 | $79,630 |
| 2021 | $7,573 | $105,220 | $25,590 | $79,630 |
| 2020 | $7,638 | $105,220 | $25,590 | $79,630 |
| 2019 | $6,907 | $84,150 | $20,480 | $63,670 |
| 2018 | $6,622 | $84,150 | $20,480 | $63,670 |
| 2017 | $6,451 | $84,150 | $20,480 | $63,670 |
| 2016 | $6,260 | $76,660 | $20,270 | $56,390 |
| 2015 | $6,301 | $76,660 | $20,270 | $56,390 |
| 2014 | $6,308 | $76,660 | $20,270 | $56,390 |
| 2013 | $3,210 | $76,650 | $20,265 | $56,385 |
Source: Public Records
Map
Nearby Homes
- 5963 Sandy Rings Ln
- 5781 Wilcox Rd
- 6183 Donegan Way Unit 8
- 6214 Donegan Way
- 6295 Donegan Way
- 5839 Castleknock Rd
- 5950 Varwyne Dr
- 5720 Sandymount Dr
- 0 Rings Rd
- 6247 Hampton Green Place Unit D
- 5613 Brighton Hill Ln
- 5856 Locbury Ln Unit R
- 6228 Rings Rd
- 6658 Traquair Place
- 6037 Baronscourt Way
- 6124 Inishmore Ln
- 6049 Craughwell Ln Unit 4
- 5444 Carson City Ln
- 6117 Craughwell Ln
- 5747 Glendavon Place
- 6155 Northcliff Blvd
- 6082 Pirthshire St
- 6131 Northcliff Blvd
- 6003 Northcliff Ct
- 6074 Pirthshire St
- 6150 Northcliff Blvd
- 6011 Northcliff Ct
- 6142 Northcliff Blvd
- 6123 Northcliff Blvd
- 6158 Northcliff Blvd
- 6134 Northcliff Blvd
- 6066 Pirthshire St
- 6097 Pirthshire St
- 6089 Pirthshire St
- 6105 Pirthshire St
- 6019 Northcliff Ct
- 6126 Northcliff Blvd
- 6115 Northcliff Blvd
- 6081 Pirthshire St