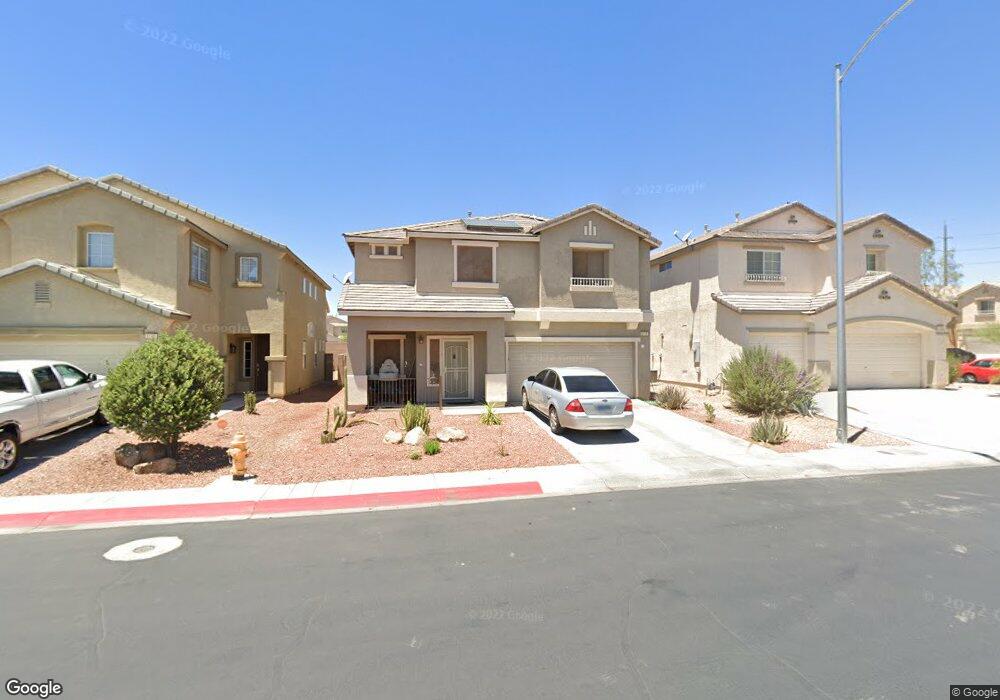
6149 Darnley St North Las Vegas, NV 89081
Northridge NeighborhoodEstimated Value: $395,000 - $407,000
3
Beds
3
Baths
1,839
Sq Ft
$217/Sq Ft
Est. Value
About This Home
This home is located at 6149 Darnley St, North Las Vegas, NV 89081 and is currently estimated at $398,690, approximately $216 per square foot. 6149 Darnley St is a home located in Clark County with nearby schools including John Tartan Elementary School, Carroll M. Johnston STEM Academy of Environmental Studies, and Clifford O. Findlay Middle School.
Ownership History
Date
Name
Owned For
Owner Type
Purchase Details
Closed on
Sep 6, 2023
Sold by
Haley Sparkiel
Bought by
Snhaley Living Trust and Haley
Current Estimated Value
Purchase Details
Closed on
Nov 18, 2009
Sold by
Ernst Phillip W
Bought by
Haley Sparkiel
Home Financials for this Owner
Home Financials are based on the most recent Mortgage that was taken out on this home.
Original Mortgage
$96,662
Interest Rate
4.83%
Mortgage Type
FHA
Purchase Details
Closed on
Jan 22, 2005
Sold by
Us Home Corp
Bought by
Ernst Phillip W
Home Financials for this Owner
Home Financials are based on the most recent Mortgage that was taken out on this home.
Original Mortgage
$259,100
Interest Rate
5.62%
Mortgage Type
New Conventional
Create a Home Valuation Report for This Property
The Home Valuation Report is an in-depth analysis detailing your home's value as well as a comparison with similar homes in the area
Home Values in the Area
Average Home Value in this Area
Purchase History
| Date | Buyer | Sale Price | Title Company |
|---|---|---|---|
| Snhaley Living Trust | -- | None Listed On Document | |
| Haley Sparkiel | $130,000 | Stewart Title Las Vegas War | |
| Ernst Phillip W | $323,875 | North American Title Co |
Source: Public Records
Mortgage History
| Date | Status | Borrower | Loan Amount |
|---|---|---|---|
| Previous Owner | Haley Sparkiel | $96,662 | |
| Previous Owner | Ernst Phillip W | $259,100 | |
| Closed | Ernst Phillip W | $64,750 |
Source: Public Records
Tax History Compared to Growth
Tax History
| Year | Tax Paid | Tax Assessment Tax Assessment Total Assessment is a certain percentage of the fair market value that is determined by local assessors to be the total taxable value of land and additions on the property. | Land | Improvement |
|---|---|---|---|---|
| 2025 | $1,422 | $106,602 | $32,200 | $74,402 |
| 2024 | $1,381 | $106,602 | $32,200 | $74,402 |
| 2023 | $1,113 | $102,232 | $32,200 | $70,032 |
| 2022 | $1,341 | $88,789 | $24,850 | $63,939 |
| 2021 | $1,302 | $84,492 | $23,800 | $60,692 |
| 2020 | $1,261 | $82,124 | $22,050 | $60,074 |
| 2019 | $1,246 | $77,922 | $18,900 | $59,022 |
| 2018 | $1,188 | $68,629 | $15,050 | $53,579 |
| 2017 | $1,996 | $59,387 | $13,300 | $46,087 |
| 2016 | $1,113 | $52,201 | $10,850 | $41,351 |
| 2015 | $1,110 | $41,163 | $7,700 | $33,463 |
| 2014 | $1,076 | $30,996 | $5,600 | $25,396 |
Source: Public Records
Map
Nearby Homes
- 2916 Kildare Cove Ct
- 6120 Alderley Ct
- 2771 Alderly Ridge Ave
- 5953 Addy Ln
- 2650 Dahlia Falls Ave Unit 126
- 3208 Aspinwall Ct
- 2646 Dahlia Falls Ave
- 2646 Dahlia Falls Ave Unit 125
- 3217 Aspinwall Ct
- 2634 Dahlia Falls Ave Unit 122
- 6040 Eganridge Ct
- 2621 Torch Ave
- 6322 Highledge St
- 3156 Mclennan Ave
- 3128 Spring City Ave
- 1865 Plan at Kalea Bay
- 1795 Plan at Kalea Bay
- 1715 Plan at Kalea Bay
- 6067 Orchid Falls St Unit 13
- 6071 Orchid Falls St Unit 14
- 6145 Darnley St
- 6153 Darnley St
- 2917 Tilten Kilt Ave
- 6141 Darnley St
- 2913 Tilten Kilt Ave
- 6146 Sydney Bay Ct
- 6146 Sydney Bay Ct Unit n/a
- 6137 Darnley St
- 6150 Darnley St
- 6142 Sydney Bay Ct
- 6146 Darnley St
- 6154 Darnley St
- 6142 Darnley St
- 2909 Tilten Kilt Ave
- 6133 Darnley St
- 6133 Darnley St Unit n/a
- 6138 Sydney Bay Ct
- 2924 Tilten Kilt Ave Unit 3
- 2920 Tilten Kilt Ave Unit 3
- 6138 Darnley St