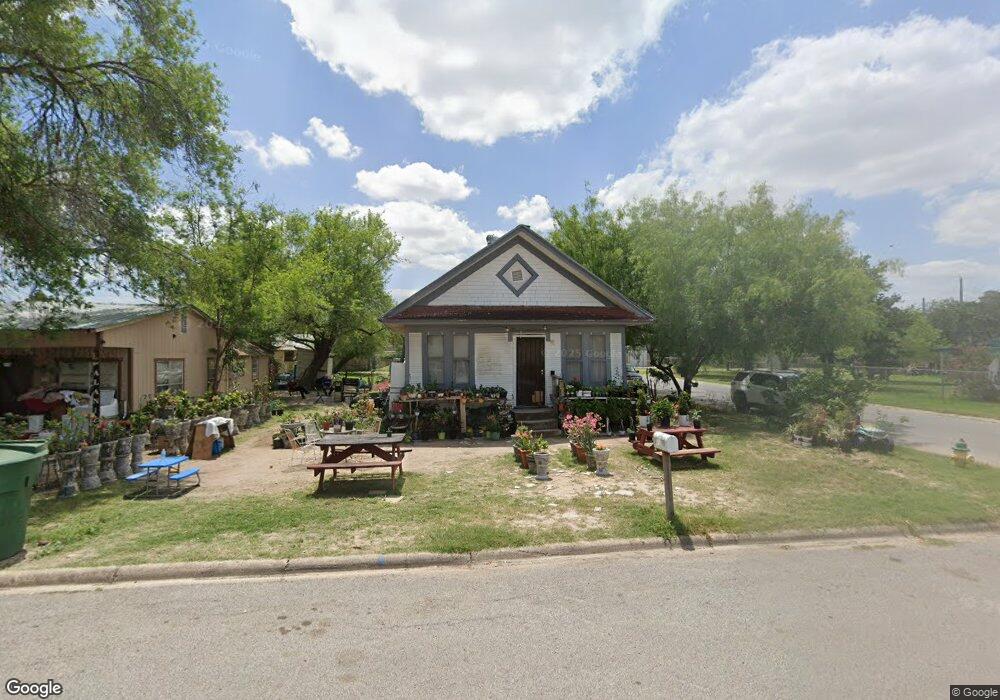
615 Athol St San Juan, TX 78589
Estimated Value: $118,000 - $220,000
2
Beds
6
Baths
2,378
Sq Ft
$70/Sq Ft
Est. Value
About This Home
This home is located at 615 Athol St, San Juan, TX 78589 and is currently estimated at $167,046, approximately $70 per square foot. 615 Athol St is a home located in Hidalgo County with nearby schools including Vida N. Clover Elementary, Stephen F. Austin Middle School, and PSJA Early College High School.
Ownership History
Date
Name
Owned For
Owner Type
Purchase Details
Closed on
Apr 24, 2009
Sold by
Rio Valley Properties Inc
Bought by
Trujillo Inocencio and Gomez Magdalena
Current Estimated Value
Home Financials for this Owner
Home Financials are based on the most recent Mortgage that was taken out on this home.
Original Mortgage
$27,000
Interest Rate
5.2%
Mortgage Type
Seller Take Back
Purchase Details
Closed on
Jul 17, 2006
Sold by
Garco Ltd
Bought by
Cantu Dario and Cantu Maria Guadalupe
Home Financials for this Owner
Home Financials are based on the most recent Mortgage that was taken out on this home.
Original Mortgage
$17,400
Interest Rate
6.62%
Mortgage Type
Purchase Money Mortgage
Purchase Details
Closed on
Jul 16, 1997
Sold by
Tennant Madeleine S and Tennant Charles
Bought by
Botello Pedro and Botello Rosa Maria
Create a Home Valuation Report for This Property
The Home Valuation Report is an in-depth analysis detailing your home's value as well as a comparison with similar homes in the area
Home Values in the Area
Average Home Value in this Area
Purchase History
| Date | Buyer | Sale Price | Title Company |
|---|---|---|---|
| Trujillo Inocencio | -- | None Available | |
| Cantu Dario | -- | None Available | |
| Botello Pedro | -- | Security Land Title Co |
Source: Public Records
Mortgage History
| Date | Status | Borrower | Loan Amount |
|---|---|---|---|
| Previous Owner | Trujillo Inocencio | $27,000 | |
| Previous Owner | Cantu Dario | $17,400 |
Source: Public Records
Tax History Compared to Growth
Tax History
| Year | Tax Paid | Tax Assessment Tax Assessment Total Assessment is a certain percentage of the fair market value that is determined by local assessors to be the total taxable value of land and additions on the property. | Land | Improvement |
|---|---|---|---|---|
| 2025 | $4,640 | $218,437 | $102,410 | $116,027 |
| 2024 | $4,640 | $180,402 | $102,410 | $77,992 |
| 2023 | $3,864 | $149,223 | $74,480 | $74,743 |
| 2022 | $3,845 | $139,118 | $55,195 | $83,923 |
| 2021 | $2,640 | $93,395 | $44,555 | $48,840 |
| 2020 | $2,261 | $78,651 | $39,900 | $38,751 |
| 2019 | $1,003 | $33,643 | $19,250 | $14,393 |
| 2018 | $1,018 | $33,963 | $19,250 | $14,713 |
| 2017 | $1,064 | $35,242 | $19,250 | $15,992 |
| 2016 | $868 | $28,760 | $14,700 | $14,060 |
| 2015 | $858 | $29,983 | $14,700 | $15,283 |
Source: Public Records
Map
Nearby Homes
- 606 W Athol Ave
- 706 Ebony St
- 608 Hackberry Ave
- 407 N Veterans Blvd
- 310 W 2nd St
- 1220 E Lucas Ave
- 106 N Standard Ave
- 213 W 2nd St
- 000 E Business 83
- TBD E Business 83
- 111 N Nebraska Ave
- 1000 E Juarez Ave
- 606 Calle Del Sol
- 300 W Amy Dr Unit A, B, C, D
- 300 W Amy Dr
- 1013 E San Antonio Ave
- 0 E Expressway 83
- 1102 E Eller Ave
- 603 S Miguel Hidalgo St
- 317 S Magnolia St