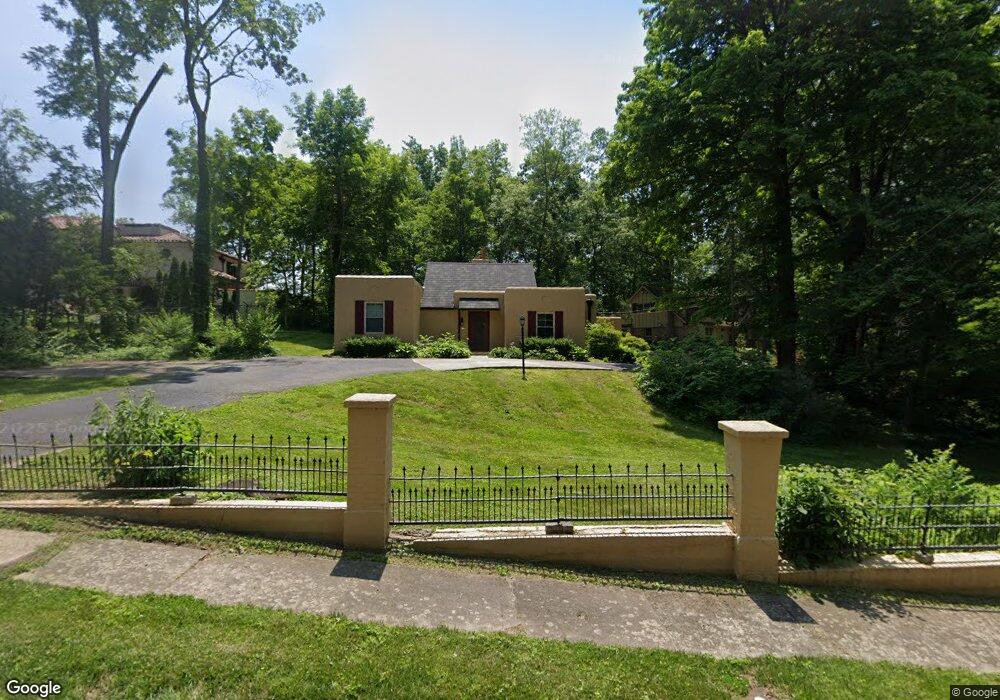
615 Cherry St New Castle, IN 47362
Estimated Value: $136,000 - $176,000
2
Beds
1
Bath
1,494
Sq Ft
$108/Sq Ft
Est. Value
About This Home
This home is located at 615 Cherry St, New Castle, IN 47362 and is currently estimated at $160,892, approximately $107 per square foot. 615 Cherry St is a home located in Henry County with nearby schools including Agape Learning Center.
Ownership History
Date
Name
Owned For
Owner Type
Purchase Details
Closed on
Sep 7, 2011
Sold by
Bank Of New York Mellon Trust Co Na
Bought by
Groce Mark A and Groce Julie E
Current Estimated Value
Purchase Details
Closed on
Aug 9, 2011
Sold by
Cary Freddy Mitchell and Cary Freddy M
Bought by
The Bank Of New York Mellon Trust Co Na and The Bank Of New York Trust Company Na
Purchase Details
Closed on
Apr 6, 2005
Sold by
Cary Bonnie and Cary Freddy Mitchell
Bought by
Cary Freddy M
Home Financials for this Owner
Home Financials are based on the most recent Mortgage that was taken out on this home.
Original Mortgage
$135,000
Interest Rate
5.88%
Mortgage Type
New Conventional
Create a Home Valuation Report for This Property
The Home Valuation Report is an in-depth analysis detailing your home's value as well as a comparison with similar homes in the area
Home Values in the Area
Average Home Value in this Area
Purchase History
| Date | Buyer | Sale Price | Title Company |
|---|---|---|---|
| Groce Mark A | $14,900 | None Available | |
| The Bank Of New York Mellon Trust Co Na | $33,000 | None Available | |
| Cary Freddy M | -- | Hoosier Title & Trust |
Source: Public Records
Mortgage History
| Date | Status | Borrower | Loan Amount |
|---|---|---|---|
| Previous Owner | Cary Freddy M | $135,000 |
Source: Public Records
Tax History Compared to Growth
Tax History
| Year | Tax Paid | Tax Assessment Tax Assessment Total Assessment is a certain percentage of the fair market value that is determined by local assessors to be the total taxable value of land and additions on the property. | Land | Improvement |
|---|---|---|---|---|
| 2024 | $1,960 | $98,000 | $39,800 | $58,200 |
| 2023 | $1,812 | $90,600 | $39,800 | $50,800 |
| 2022 | $1,524 | $76,200 | $31,800 | $44,400 |
| 2021 | $1,512 | $75,600 | $31,800 | $43,800 |
| 2020 | $1,377 | $66,800 | $26,100 | $40,700 |
| 2019 | $1,357 | $65,800 | $26,100 | $39,700 |
| 2018 | $1,339 | $65,100 | $26,100 | $39,000 |
| 2017 | $1,372 | $64,800 | $26,100 | $38,700 |
| 2016 | $1,554 | $63,900 | $26,100 | $37,800 |
| 2014 | $1,234 | $61,700 | $26,100 | $35,600 |
| 2013 | $1,234 | $60,100 | $26,100 | $34,000 |
Source: Public Records
Map
Nearby Homes