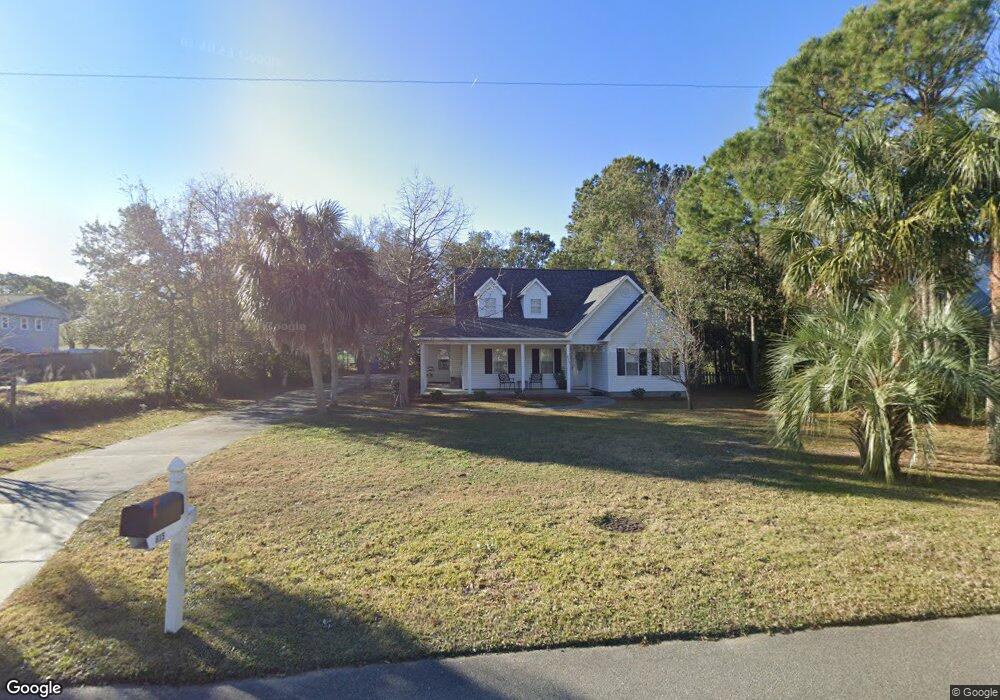
615 Clarendon Blvd Carolina Beach, NC 28428
Estimated Value: $781,000 - $923,000
3
Beds
2
Baths
1,822
Sq Ft
$460/Sq Ft
Est. Value
About This Home
This home is located at 615 Clarendon Blvd, Carolina Beach, NC 28428 and is currently estimated at $837,850, approximately $459 per square foot. 615 Clarendon Blvd is a home located in New Hanover County with nearby schools including Carolina Beach Elementary School, Charles P. Murray Middle School, and Eugene Ashley High School.
Ownership History
Date
Name
Owned For
Owner Type
Purchase Details
Closed on
Oct 29, 2004
Sold by
Stanley Linda R
Bought by
Mcgirt James L Susan D
Current Estimated Value
Purchase Details
Closed on
Oct 22, 2002
Sold by
Rd Hartsell Homes Inc
Bought by
Stanley Linda R
Purchase Details
Closed on
Dec 14, 2001
Sold by
Wilborn Louis B
Bought by
Rd Hartsell Homes Inc
Purchase Details
Closed on
Mar 5, 1999
Sold by
Double B Corp Of Nc
Bought by
Wilborn Louis B
Purchase Details
Closed on
Jun 1, 1998
Sold by
Wilborn Louis B
Bought by
Double B Corp Of Nc
Purchase Details
Closed on
Oct 20, 1997
Sold by
Palmer William Iris
Bought by
Wilborn Louis B
Purchase Details
Closed on
Jan 7, 1994
Sold by
Doughman Teresa Miller Jerome
Bought by
Palmer William Iris
Purchase Details
Closed on
Mar 19, 1990
Sold by
Knesel John Kathy
Bought by
Miller Teresa
Purchase Details
Closed on
Apr 1, 1984
Sold by
Knesel John Kathy
Bought by
Miller Teresa
Create a Home Valuation Report for This Property
The Home Valuation Report is an in-depth analysis detailing your home's value as well as a comparison with similar homes in the area
Home Values in the Area
Average Home Value in this Area
Purchase History
| Date | Buyer | Sale Price | Title Company |
|---|---|---|---|
| Mcgirt James L Susan D | $305,000 | -- | |
| Stanley Linda R | $215,000 | -- | |
| Rd Hartsell Homes Inc | $39,000 | -- | |
| Wilborn Louis B | $61,000 | -- | |
| Double B Corp Of Nc | -- | -- | |
| Wilborn Louis B | $42,500 | -- | |
| Palmer William Iris | $21,000 | -- | |
| Miller Teresa | -- | -- | |
| Miller Teresa | $16,000 | -- |
Source: Public Records
Tax History Compared to Growth
Tax History
| Year | Tax Paid | Tax Assessment Tax Assessment Total Assessment is a certain percentage of the fair market value that is determined by local assessors to be the total taxable value of land and additions on the property. | Land | Improvement |
|---|---|---|---|---|
| 2025 | $3,595 | $938,300 | $445,000 | $493,300 |
| 2023 | $3,595 | $524,800 | $280,000 | $244,800 |
| 2022 | $3,516 | $524,800 | $280,000 | $244,800 |
| 2021 | $3,621 | $524,800 | $280,000 | $244,800 |
| 2020 | $2,546 | $318,200 | $116,500 | $201,700 |
| 2019 | $2,546 | $318,200 | $116,500 | $201,700 |
| 2018 | $2,482 | $318,200 | $116,500 | $201,700 |
| 2017 | $2,530 | $318,200 | $116,500 | $201,700 |
| 2016 | $2,473 | $288,200 | $124,800 | $163,400 |
| 2015 | $2,332 | $288,200 | $124,800 | $163,400 |
| 2014 | $2,274 | $288,200 | $124,800 | $163,400 |
Source: Public Records
Map
Nearby Homes
- 613 Clarendon Ave
- 418 Columbia Ave
- 414 Atlanta Ave
- 617 Sumter Ave Unit 1
- 617 Sumter Ave Unit 1
- 801 Atlanta Ave
- 608 Greenville Ave Unit B
- 105 Fifth St
- 607 Cape Fear Blvd
- 517 Greenville Ave
- 804 Fayetteville Ave
- 411 Spartanburg Ave
- 805 Hamlet Ave
- 304 Birmingham Ave Unit 2
- 304 Columbia Ave Unit B
- 307 Fayetteville Ave
- 609 Augusta Ave
- 415 Greenville Ave Unit A
- 1101 Sixth St S
- 1100 S 6th St
- 613 Clarendon Blvd
- 601 Clarendon Blvd
- 601 Clarendon Ave
- 604 Columbia Ave
- 504 S 6th St
- 506 S 6th St
- 600 Columbia Ave
- 610 Clarendon Blvd
- 604 Clarendon Blvd
- 408 Sixth St S
- 619 Clarendon Blvd
- 607 S 6th St
- 933 S 6th St
- 618 Columbia Ave
- 406 S 6th St
- 609 Columbia Ave
- 618 Clarendon Ave
- 618 Clarendon Blvd
- 404 S 6th St
- 607 Columbia Ave