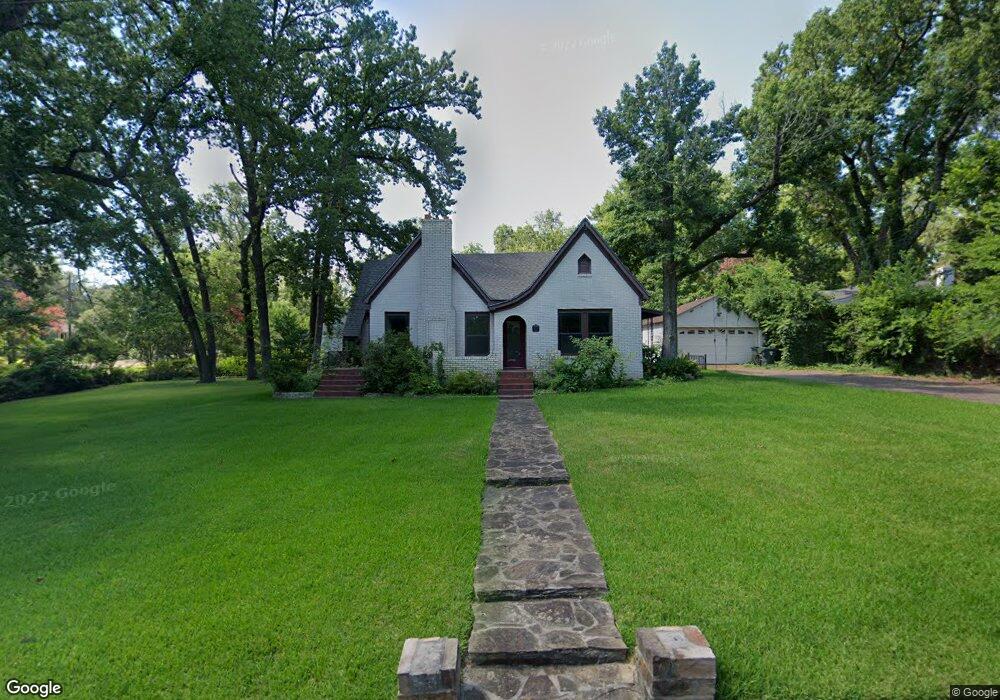
615 E 1st St Tyler, TX 75701
Azalea District NeighborhoodEstimated Value: $253,655 - $300,000
2
Beds
2
Baths
1,636
Sq Ft
$165/Sq Ft
Est. Value
About This Home
This home is located at 615 E 1st St, Tyler, TX 75701 and is currently estimated at $270,664, approximately $165 per square foot. 615 E 1st St is a home located in Smith County with nearby schools including Bell Elementary School, Hogg Middle School, and Tyler Legacy High School.
Ownership History
Date
Name
Owned For
Owner Type
Purchase Details
Closed on
Jun 4, 2021
Sold by
England Sara
Bought by
Davis Victor B and Davis Jennifer
Current Estimated Value
Home Financials for this Owner
Home Financials are based on the most recent Mortgage that was taken out on this home.
Original Mortgage
$178,600
Outstanding Balance
$160,994
Interest Rate
2.9%
Mortgage Type
New Conventional
Estimated Equity
$109,670
Purchase Details
Closed on
Sep 28, 2020
Sold by
Walters Pamela L and Moore Pamela Waltes
Bought by
England Sara
Home Financials for this Owner
Home Financials are based on the most recent Mortgage that was taken out on this home.
Original Mortgage
$122,735
Interest Rate
2.9%
Mortgage Type
FHA
Purchase Details
Closed on
Sep 15, 2016
Sold by
Shaw Farrell Lee and Shaw Larkin
Bought by
Walters Pamela L
Home Financials for this Owner
Home Financials are based on the most recent Mortgage that was taken out on this home.
Original Mortgage
$75,000
Interest Rate
3.43%
Purchase Details
Closed on
Aug 28, 2014
Sold by
Shaw Farrell
Bought by
Shaw Farrell and Shaw Larkin
Create a Home Valuation Report for This Property
The Home Valuation Report is an in-depth analysis detailing your home's value as well as a comparison with similar homes in the area
Home Values in the Area
Average Home Value in this Area
Purchase History
| Date | Buyer | Sale Price | Title Company |
|---|---|---|---|
| Davis Victor B | -- | None Available | |
| England Sara | -- | None Available | |
| Walters Pamela L | -- | None Available | |
| Shaw Farrell | -- | None Available |
Source: Public Records
Mortgage History
| Date | Status | Borrower | Loan Amount |
|---|---|---|---|
| Open | Davis Victor B | $178,600 | |
| Previous Owner | England Sara | $122,735 | |
| Previous Owner | Walters Pamela L | $75,000 |
Source: Public Records
Tax History Compared to Growth
Tax History
| Year | Tax Paid | Tax Assessment Tax Assessment Total Assessment is a certain percentage of the fair market value that is determined by local assessors to be the total taxable value of land and additions on the property. | Land | Improvement |
|---|---|---|---|---|
| 2025 | $4,413 | $320,769 | $126,586 | $194,183 |
| 2024 | $4,413 | $259,415 | $62,700 | $196,715 |
| 2023 | $4,325 | $248,138 | $62,700 | $185,438 |
| 2022 | $3,919 | $200,010 | $44,726 | $155,284 |
| 2021 | $3,346 | $159,460 | $44,726 | $114,734 |
| 2020 | $3,242 | $151,504 | $44,726 | $106,778 |
| 2019 | $3,119 | $142,656 | $41,800 | $100,856 |
| 2018 | $2,890 | $132,860 | $41,800 | $91,060 |
| 2017 | $2,909 | $136,246 | $41,800 | $94,446 |
| 2016 | $2,877 | $134,752 | $41,800 | $92,952 |
| 2015 | $3,227 | $170,780 | $41,800 | $128,980 |
| 2014 | $3,227 | $163,260 | $41,800 | $121,460 |
Source: Public Records
Map
Nearby Homes
- 520 E Lake St
- 1226 S Fleishel Ave
- 309 E Dodge St
- 1118 S Fleishel Ave
- 300 E Dodge St
- 114 E 2nd St
- 517 E Wells St
- 1931 S Wiley Ave
- 735 S Donnybrook Ave
- 128 Rowland Place
- 124 Rowland Place
- 145 Rowland Place
- 2026 S Wall Ave
- 2110 Belmont Dr
- 2108 S Wall Ave
- 325 W 4th St
- 310 W Dobbs St
- 400 Lindsey Ln
- 201 W Rusk St
- 1300 Sunset Dr
- 615 615 E 1st St
- 1309 Belmont Dr
- 1302 S Sneed Ave
- 717 E 1st St
- 1302 1302 S Sneed Ave
- 1215 Belmont Dr
- 1310 1310 S Sneed Ave
- 1310 S Sneed Ave
- 1215 1215 Belmont
- 1222 S Sneed Ave
- 1222 1222 Sneed
- 1222 1222 S Sneed
- 1319 Belmont Dr
- 1306 Belmont Dr
- 1218 Belmont Dr
- 1208 S Sneed Ave
- 1218 1218 S Belmont
- 1328 S Sneed Ave
- 1312 Belmont Dr
- 1212 Belmont Dr