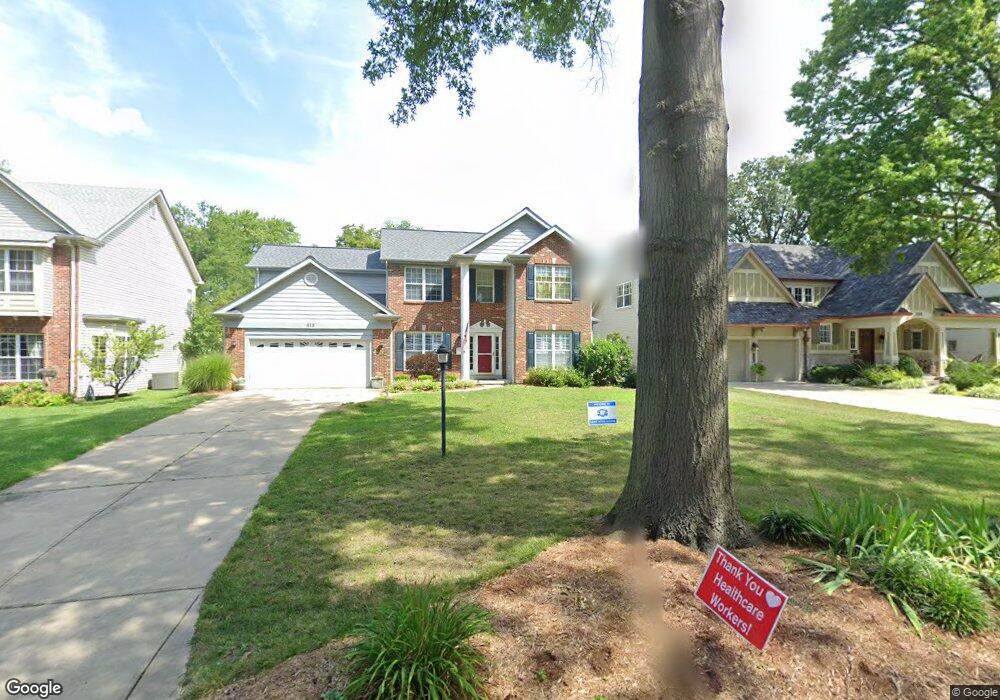
615 Gaslite Ln Saint Louis, MO 63122
Estimated Value: $845,000 - $954,000
4
Beds
4
Baths
2,946
Sq Ft
$298/Sq Ft
Est. Value
About This Home
This home is located at 615 Gaslite Ln, Saint Louis, MO 63122 and is currently estimated at $877,743, approximately $297 per square foot. 615 Gaslite Ln is a home located in St. Louis County with nearby schools including F.P. Tillman Elementary School, Nipher Middle School, and Kirkwood Senior High School.
Ownership History
Date
Name
Owned For
Owner Type
Purchase Details
Closed on
Jul 9, 2018
Bought by
Mccall Peter K
Current Estimated Value
Home Financials for this Owner
Home Financials are based on the most recent Mortgage that was taken out on this home.
Original Mortgage
$440,000
Interest Rate
4.52%
Purchase Details
Closed on
Dec 21, 2010
Sold by
Hewitt David M and Hewitt Christine A
Bought by
Leahy Patrick J and Leahy Mary K
Home Financials for this Owner
Home Financials are based on the most recent Mortgage that was taken out on this home.
Original Mortgage
$376,000
Interest Rate
4.41%
Mortgage Type
New Conventional
Purchase Details
Closed on
Aug 31, 2001
Sold by
Dost Gaslight Inc
Bought by
Hewitt David M and Hewitt Christine A
Home Financials for this Owner
Home Financials are based on the most recent Mortgage that was taken out on this home.
Original Mortgage
$275,000
Interest Rate
6.98%
Create a Home Valuation Report for This Property
The Home Valuation Report is an in-depth analysis detailing your home's value as well as a comparison with similar homes in the area
Home Values in the Area
Average Home Value in this Area
Purchase History
| Date | Buyer | Sale Price | Title Company |
|---|---|---|---|
| Mccall Peter K | -- | -- | |
| Leahy Patrick J | $470,000 | Investors Title Company | |
| Hewitt David M | $400,000 | -- |
Source: Public Records
Mortgage History
| Date | Status | Borrower | Loan Amount |
|---|---|---|---|
| Open | Mccall Peter K | $426,000 | |
| Closed | Mccall Peter K | $440,000 | |
| Closed | Mccall Peter K | -- | |
| Previous Owner | Leahy Patrick J | $376,000 | |
| Previous Owner | Hewitt David M | $275,000 |
Source: Public Records
Tax History
| Year | Tax Paid | Tax Assessment Tax Assessment Total Assessment is a certain percentage of the fair market value that is determined by local assessors to be the total taxable value of land and additions on the property. | Land | Improvement |
|---|---|---|---|---|
| 2025 | $7,913 | $148,370 | $47,670 | $100,700 |
| 2024 | $7,913 | $126,270 | $39,710 | $86,560 |
| 2023 | $7,789 | $126,270 | $39,710 | $86,560 |
| 2022 | $7,762 | $117,420 | $37,700 | $79,720 |
| 2021 | $7,661 | $117,420 | $37,700 | $79,720 |
| 2020 | $7,246 | $106,770 | $37,700 | $69,070 |
| 2019 | $7,247 | $106,770 | $37,700 | $69,070 |
| 2018 | $7,344 | $95,580 | $28,600 | $66,980 |
| 2017 | $7,335 | $95,580 | $28,600 | $66,980 |
| 2016 | $6,637 | $87,140 | $22,250 | $64,890 |
Source: Public Records
Map
Nearby Homes
- 686 Brownell Ave
- 754 Brownell Ave
- 582 Drury Ln
- 887 Dickson St
- 424 Julian Place
- 339 Bogey Ln
- 582 Brookhaven Ct
- 320 Bogey Ln
- 412 Hawbrook Ct
- 361 E Bodley Ave
- 683 Hawbrook Ave
- 8 S Moreland Ave
- 1031 Glenway Dr
- 621 Meadowridge Ln
- 216 Elm Ave
- 938 Hawbrook Rd
- 1026 Kirkham Ave
- 534 E Jefferson Ave
- 918 Nancy Carol Ln
- 815 Brookside Dr
- 621 Gaslite Ln
- 607 Gaslite Ln
- 629 Gaslite Ln
- 601 Gaslite Ln
- 734 Dickson St
- 614 Gaslite Ln
- 620 Gaslite Ln
- 625 Florist Ave
- 628 Gaslite Ln
- 606 Gaslite Ln
- 621 Florist Ave
- 631 Florist Ave
- 635 Gaslite Ln
- 634 Gaslite Ln
- 615 Windrush Dr
- 609 Windrush Dr
- 736 Dickson St
- 740 Dickson St
- 635 Florist Ave
- 621 Windrush Dr
Your Personal Tour Guide
Ask me questions while you tour the home.