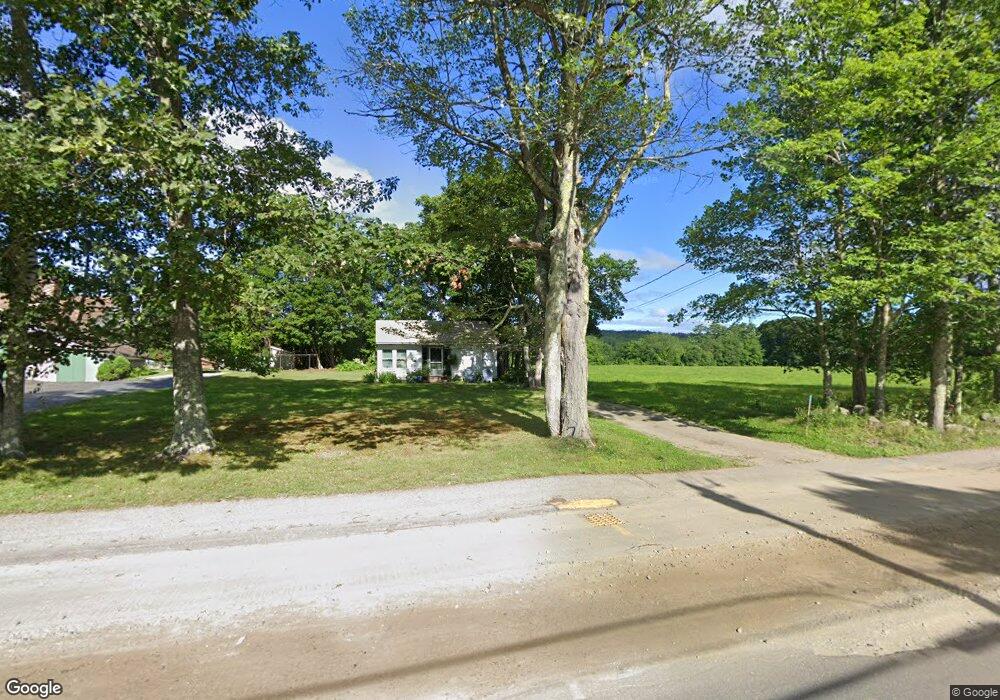
615 Main St Monmouth, ME 04259
Estimated Value: $444,000 - $550,000
3
Beds
3
Baths
1,362
Sq Ft
$367/Sq Ft
Est. Value
About This Home
This home is located at 615 Main St, Monmouth, ME 04259 and is currently estimated at $500,262, approximately $367 per square foot. 615 Main St is a home located in Kennebec County with nearby schools including Hall-Dale Elementary School, Marcia Buker School, and Dresden Elementary School.
Ownership History
Date
Name
Owned For
Owner Type
Purchase Details
Closed on
Jun 26, 2018
Sold by
Trenholm Tracey A
Bought by
Trenholm Christopher R
Current Estimated Value
Home Financials for this Owner
Home Financials are based on the most recent Mortgage that was taken out on this home.
Original Mortgage
$230,000
Outstanding Balance
$199,329
Interest Rate
4.5%
Mortgage Type
Unknown
Estimated Equity
$300,933
Purchase Details
Closed on
May 12, 2016
Sold by
Trenholm Christopher
Bought by
Trenholm Christopher and Trenholm Tracey A
Home Financials for this Owner
Home Financials are based on the most recent Mortgage that was taken out on this home.
Original Mortgage
$229,000
Interest Rate
3.71%
Mortgage Type
Unknown
Purchase Details
Closed on
Nov 21, 2014
Sold by
Banta Richard S and Gastineau Karin R
Bought by
Trenholm Christopher
Purchase Details
Closed on
Sep 21, 2007
Sold by
Painters Llc Est
Bought by
Banta Richard S and Gastineau-Banta Karin R
Create a Home Valuation Report for This Property
The Home Valuation Report is an in-depth analysis detailing your home's value as well as a comparison with similar homes in the area
Home Values in the Area
Average Home Value in this Area
Purchase History
| Date | Buyer | Sale Price | Title Company |
|---|---|---|---|
| Trenholm Christopher R | -- | -- | |
| Trenholm Christopher | -- | -- | |
| Trenholm Christopher | -- | -- | |
| Banta Richard S | -- | -- |
Source: Public Records
Mortgage History
| Date | Status | Borrower | Loan Amount |
|---|---|---|---|
| Open | Trenholm Christopher R | $230,000 | |
| Closed | Trenholm Christopher | $229,000 |
Source: Public Records
Tax History Compared to Growth
Tax History
| Year | Tax Paid | Tax Assessment Tax Assessment Total Assessment is a certain percentage of the fair market value that is determined by local assessors to be the total taxable value of land and additions on the property. | Land | Improvement |
|---|---|---|---|---|
| 2024 | $6,556 | $320,600 | $97,300 | $223,300 |
| 2023 | $5,803 | $320,600 | $97,300 | $223,300 |
| 2022 | $5,437 | $278,800 | $84,600 | $194,200 |
| 2021 | $5,241 | $278,800 | $84,600 | $194,200 |
| 2020 | $5,060 | $278,800 | $84,600 | $194,200 |
| 2018 | $4,893 | $278,800 | $84,600 | $194,200 |
| 2017 | $4,893 | $278,800 | $84,600 | $194,200 |
| 2016 | $1,384 | $83,600 | $83,600 | $0 |
| 2015 | $1,304 | $83,600 | $83,600 | $0 |
| 2013 | $1,216 | $83,600 | $83,600 | $0 |
Source: Public Records
Map
Nearby Homes
- 723 Main St
- 745 Main St
- 18 Gray Mill Rd
- 256 Blue Rd
- 3 Ridge Rd
- 297 Norris Hill Rd
- 15 Blue Rock Rd Unit 26
- 15 Blue Rock Rd Unit 24
- 15 Blue Rock Rd Unit 34
- 51 Sandy Dr
- 33 Sandy Dr
- 35002 Waugan Rd
- 25 Hansons Wood Rd
- 200 Back St
- 11 Neal Ln
- 57 Neal Ln
- 61 Highland Terrace
- 34 Gerber Ln
- 33 Gerber Ln
- 33-34 Gerber Ln