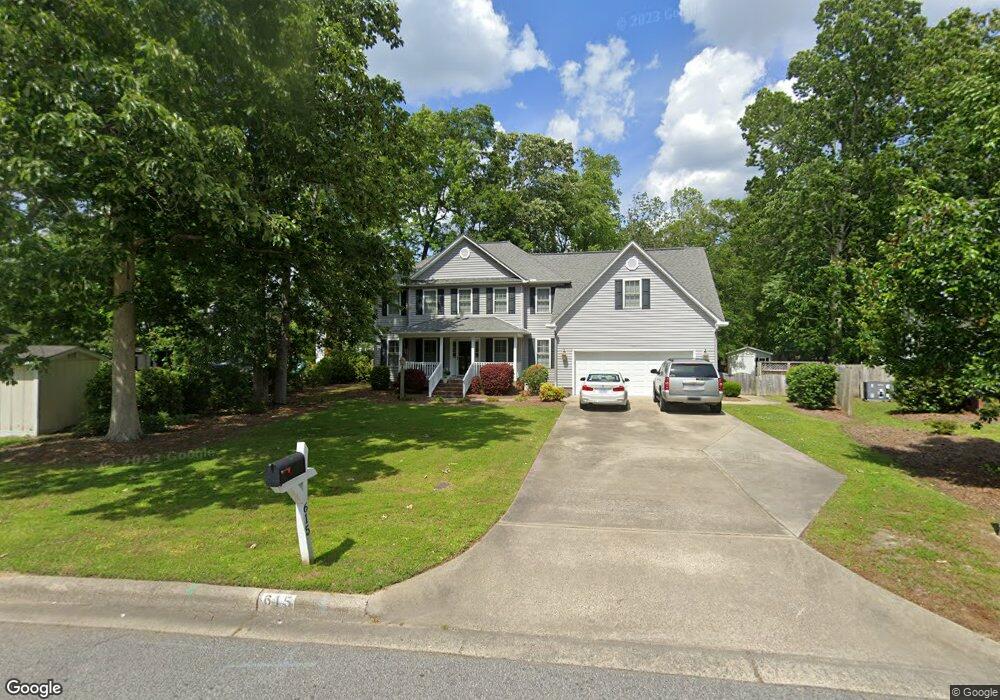
615 Merchant Dr Winterville, NC 28590
Estimated Value: $354,000 - $379,000
3
Beds
3
Baths
2,400
Sq Ft
$153/Sq Ft
Est. Value
About This Home
This home is located at 615 Merchant Dr, Winterville, NC 28590 and is currently estimated at $366,591, approximately $152 per square foot. 615 Merchant Dr is a home located in Pitt County with nearby schools including Wintergreen Primary School, Wintergreen Intermediate School, and A.G. Cox Middle School.
Ownership History
Date
Name
Owned For
Owner Type
Purchase Details
Closed on
Jun 30, 2011
Sold by
Evans Lynn W and Evans Kristen Lanier
Bought by
Baker Lonnie Thomas and Baker Tamara Mulkin
Current Estimated Value
Home Financials for this Owner
Home Financials are based on the most recent Mortgage that was taken out on this home.
Original Mortgage
$157,500
Outstanding Balance
$108,967
Interest Rate
4.63%
Mortgage Type
New Conventional
Estimated Equity
$257,624
Purchase Details
Closed on
Sep 2, 2005
Sold by
White Charles V and White Rebecca B
Bought by
Evans Lynn Watson and Evans Kristen Lanier
Home Financials for this Owner
Home Financials are based on the most recent Mortgage that was taken out on this home.
Original Mortgage
$475,000
Interest Rate
5.64%
Mortgage Type
Future Advance Clause Open End Mortgage
Create a Home Valuation Report for This Property
The Home Valuation Report is an in-depth analysis detailing your home's value as well as a comparison with similar homes in the area
Home Values in the Area
Average Home Value in this Area
Purchase History
| Date | Buyer | Sale Price | Title Company |
|---|---|---|---|
| Baker Lonnie Thomas | $210,000 | None Available | |
| Evans Lynn Watson | $417,500 | None Available |
Source: Public Records
Mortgage History
| Date | Status | Borrower | Loan Amount |
|---|---|---|---|
| Open | Baker Lonnie Thomas | $157,500 | |
| Previous Owner | Evans Lynn Watson | $475,000 |
Source: Public Records
Tax History Compared to Growth
Tax History
| Year | Tax Paid | Tax Assessment Tax Assessment Total Assessment is a certain percentage of the fair market value that is determined by local assessors to be the total taxable value of land and additions on the property. | Land | Improvement |
|---|---|---|---|---|
| 2025 | $2,266 | $339,106 | $40,000 | $299,106 |
| 2024 | $2,254 | $339,106 | $40,000 | $299,106 |
| 2023 | $1,883 | $238,315 | $35,000 | $203,315 |
| 2022 | $1,892 | $238,315 | $35,000 | $203,315 |
| 2021 | $1,883 | $238,315 | $35,000 | $203,315 |
| 2020 | $1,895 | $238,315 | $35,000 | $203,315 |
| 2019 | $1,862 | $230,114 | $35,000 | $195,114 |
| 2018 | $1,778 | $230,114 | $35,000 | $195,114 |
| 2017 | $1,778 | $230,114 | $35,000 | $195,114 |
| 2016 | $1,755 | $230,114 | $35,000 | $195,114 |
| 2015 | $1,667 | $219,870 | $36,000 | $183,870 |
| 2014 | $1,667 | $219,870 | $36,000 | $183,870 |
Source: Public Records
Map
Nearby Homes
- 2203 Franklin Dr
- 731 Winterfield Dr
- 2243 Black Horse Ln
- 874 Corbett St
- 763 Winterfield Dr
- 4695 Old Tar Rd
- 626 Winterfield Dr
- 626 Edenbrook Dr
- 561 Channel Dr
- 959 van Gert Dr
- 2335 Wedgewood Dr
- 133 Blackwater Dr
- 2136 Winder Dr
- Greystone Plan at Eli's Ridge
- Walden Plan at Eli's Ridge
- Haddock Plan at Eli's Ridge
- Halston Plan at Eli's Ridge
- Murdock Plan at Eli's Ridge
- Weaver Plan at Eli's Ridge
- Carson Plan at Eli's Ridge
- 619 Merchant Dr
- 2319 Franklin Dr
- 2331 Franklin Dr
- 2313 Franklin Dr
- 702 Shady Meadow Ct
- 2307 Franklin Dr
- 2347 Franklin Dr
- 2299 Franklin Dr
- 705 Shady Meadow Ct
- 646 Merchant Dr
- 629 Merchant Dr
- 626 Merchant Dr
- 2314 Franklin Dr
- 2353 Franklin Dr
- 2210 Sophia Cir
- 2326 Franklin Dr
- 2332 Franklin Dr
- 2338 Franklin Dr
- 635 Merchant Dr
- 2346 Franklin Dr