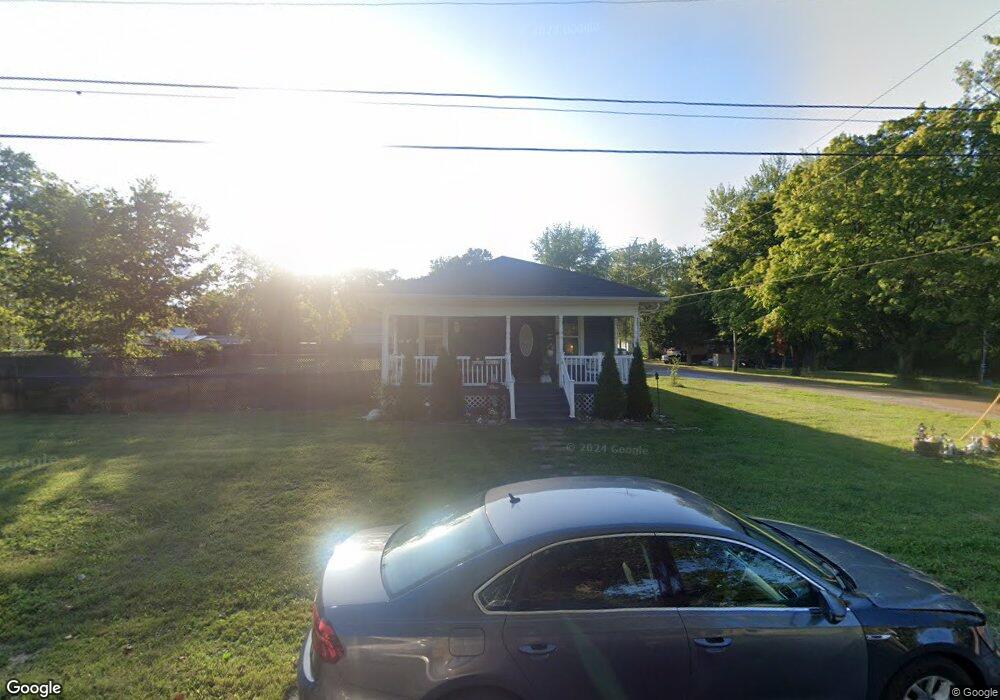
615 N Bottom St Sparta, IL 62286
Estimated Value: $83,000 - $116,000
3
Beds
1
Bath
1,248
Sq Ft
$75/Sq Ft
Est. Value
About This Home
This home is located at 615 N Bottom St, Sparta, IL 62286 and is currently estimated at $94,159, approximately $75 per square foot. 615 N Bottom St is a home located in Randolph County with nearby schools including Sparta High School.
Ownership History
Date
Name
Owned For
Owner Type
Purchase Details
Closed on
Aug 23, 2024
Sold by
Schnoeker Dean A and Schnoeker Sandra F
Bought by
Wittenborn Robert D and Wittenborn Janet L
Current Estimated Value
Purchase Details
Closed on
Jan 15, 2010
Sold by
Schnoeker Dean A
Bought by
Schnoeker Dean A and Schnoeker Sandra F
Purchase Details
Closed on
Jul 13, 2007
Sold by
Bolen Darin L
Bought by
Schnoeker Dean A
Home Financials for this Owner
Home Financials are based on the most recent Mortgage that was taken out on this home.
Original Mortgage
$45,000
Interest Rate
6.42%
Mortgage Type
New Conventional
Create a Home Valuation Report for This Property
The Home Valuation Report is an in-depth analysis detailing your home's value as well as a comparison with similar homes in the area
Home Values in the Area
Average Home Value in this Area
Purchase History
| Date | Buyer | Sale Price | Title Company |
|---|---|---|---|
| Wittenborn Robert D | -- | None Listed On Document | |
| Schnoeker Dean A | -- | None Available | |
| Schnoeker Dean A | $45,000 | None Available |
Source: Public Records
Mortgage History
| Date | Status | Borrower | Loan Amount |
|---|---|---|---|
| Previous Owner | Schnoeker Dean A | $45,000 |
Source: Public Records
Tax History
| Year | Tax Paid | Tax Assessment Tax Assessment Total Assessment is a certain percentage of the fair market value that is determined by local assessors to be the total taxable value of land and additions on the property. | Land | Improvement |
|---|---|---|---|---|
| 2024 | $1,154 | $23,170 | $4,175 | $18,995 |
| 2022 | $973 | $21,260 | $3,695 | $17,565 |
| 2021 | $1,126 | $19,875 | $3,455 | $16,420 |
| 2020 | $1,249 | $20,354 | $3,538 | $16,816 |
| 2019 | $1,045 | $18,215 | $3,165 | $15,050 |
| 2018 | $1,204 | $20,082 | $3,489 | $16,593 |
| 2017 | $996 | $18,380 | $3,195 | $15,185 |
| 2016 | $1,033 | $17,715 | $3,080 | $14,635 |
| 2015 | $1,033 | $17,715 | $3,080 | $14,635 |
| 2014 | $1,033 | $18,060 | $3,140 | $14,920 |
| 2013 | $989 | $18,290 | $3,180 | $15,110 |
Source: Public Records
Map
Nearby Homes
- 409 E Mound St
- 408 E Mound St
- 702 E Feifer St
- 714 E Feifer St
- 712 E Harrison St
- 501 N Market St
- 220 N Vine St
- 1019 E Main St
- 510 E Main St
- 316 N St Louis St
- 105 S Washington
- 540 E Broadway St
- 206 S Dewey St
- 905 N Pine St
- 151 Doc Lin Dr
- 305 N James St
- 404 S Vine St
- 410 S Saint Louis St
- 505 S Saint Louis St
- 115 W 4th St
- 412 E Sproul St
- 423 E Jefferson St
- 505 E Jefferson St
- 417 E Jefferson St
- 405 E Sproul St
- 410 E Sproul St
- 422 E Jefferson St
- 405 E Jefferson St
- 515 E Jefferson St
- 501 E Sproul St
- 416 E Jefferson St
- 400 E Sproul St
- 504 E Jefferson St
- 410 E Jefferson St
- 401 E Jefferson St
- 512 E Jefferson St
- 406 E Jefferson St
- 417 E Mound St
- 411 E Mound St
- 514 E Jefferson St
Your Personal Tour Guide
Ask me questions while you tour the home.