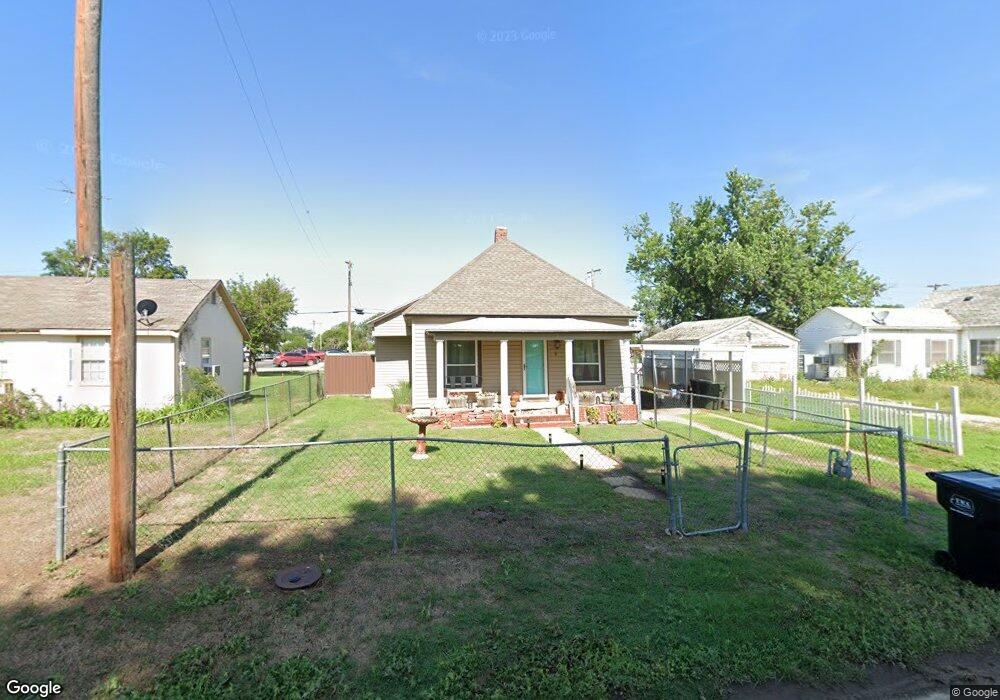
615 N Market Ave Watonga, OK 73772
Estimated Value: $56,000 - $59,678
2
Beds
1
Bath
936
Sq Ft
$61/Sq Ft
Est. Value
About This Home
This home is located at 615 N Market Ave, Watonga, OK 73772 and is currently estimated at $57,170, approximately $61 per square foot. 615 N Market Ave is a home located in Blaine County with nearby schools including Watonga Elementary School, Watonga Middle School, and Watonga High School.
Ownership History
Date
Name
Owned For
Owner Type
Purchase Details
Closed on
Jun 13, 2019
Sold by
Sawyer Dylan James
Bought by
Sawyer Dylan James and Sawyer Ashlee
Current Estimated Value
Purchase Details
Closed on
Apr 29, 2019
Sold by
Young Tanya
Bought by
Sawyer Dylan James
Purchase Details
Closed on
Jul 30, 2015
Sold by
Sawyer Robin and Sawyer Dylan
Bought by
Sawyer Dylan
Purchase Details
Closed on
Jun 16, 2015
Sold by
Sawyer Robin D and Sawyer Leigh
Bought by
Sawyer Dylan J
Purchase Details
Closed on
Apr 10, 2012
Sold by
Swayer Robin and Swayer Leigh
Bought by
Swayer Robin D and Swayer Leigh
Purchase Details
Closed on
Feb 2, 2012
Sold by
Ingram Gay Lynn
Bought by
Sawyer Robin
Purchase Details
Closed on
May 11, 2011
Sold by
Ingram Gay Lynn
Bought by
Sawyer Robin
Purchase Details
Closed on
Nov 25, 1994
Sold by
Mckinsey David and Mckinsey Sylvia
Bought by
Rosales Blanche B
Create a Home Valuation Report for This Property
The Home Valuation Report is an in-depth analysis detailing your home's value as well as a comparison with similar homes in the area
Home Values in the Area
Average Home Value in this Area
Purchase History
| Date | Buyer | Sale Price | Title Company |
|---|---|---|---|
| Sawyer Dylan James | -- | None Available | |
| Sawyer Dylan James | $23,000 | None Available | |
| Sawyer Dylan | -- | None Available | |
| Sawyer Dylan J | -- | None Available | |
| Swayer Robin D | -- | None Available | |
| Sawyer Robin | $7,000 | -- | |
| Sawyer Robin | $3,500 | None Available | |
| Rosales Blanche B | $7,000 | -- |
Source: Public Records
Tax History Compared to Growth
Tax History
| Year | Tax Paid | Tax Assessment Tax Assessment Total Assessment is a certain percentage of the fair market value that is determined by local assessors to be the total taxable value of land and additions on the property. | Land | Improvement |
|---|---|---|---|---|
| 2024 | $362 | $3,730 | $490 | $3,240 |
| 2023 | $346 | $3,553 | $490 | $3,063 |
| 2022 | $368 | $3,384 | $490 | $2,894 |
| 2021 | $317 | $3,223 | $484 | $2,739 |
| 2020 | $299 | $3,069 | $440 | $2,629 |
| 2019 | $290 | $2,923 | $473 | $2,450 |
| 2018 | $288 | $2,784 | $635 | $2,149 |
| 2017 | $228 | $2,140 | $297 | $1,843 |
| 2016 | $231 | $2,039 | $297 | $1,742 |
| 2015 | $196 | $1,942 | $297 | $1,645 |
| 2014 | $42 | $516 | $297 | $219 |
Source: Public Records
Map
Nearby Homes
- 319 N Wikoff Ave
- 409 W 3rd St
- 401 N Leach Ave
- 720 W 3rd St
- 704 N Prouty Ave
- 815 N Prouty Ave
- 711 Villa Place Unit 181A
- 321 N Flynn
- 101 E 5th St Unit 103 E 5th St
- 100 W 3rd St
- 834 Mimosa Dr
- 1017 N Prouty Ave
- 114 N Leach Ave Unit 116 118 & 120 N Leac
- 515 N Burford Ave
- 501 Northampton Dr
- 416 N Burford Ave
- 524 Skyview Dr
- 411 N Forrest Ave
- 900 N Burford Ave
- 1100 N Weigle Ave
- 609 N Market Ave
- 621 N Market Ave
- 605 N Market Ave
- 620 N Market Ave
- 612 N Market Ave
- 416 W 5th St
- 703 N Market Ave
- 417 W 6th St
- 617 N Wikoff Ave
- 705 N Market Ave
- 601 N Wikoff Ave
- 700 N Market Ave
- 621 N Wikoff Ave
- 715 N Market Ave
- 708 N Market Ave
- 520 N Market Ave
- 511 N Market Ave
- 703 N Wikoff Ave
- 515 N Market Ave
- 716 N Market Ave