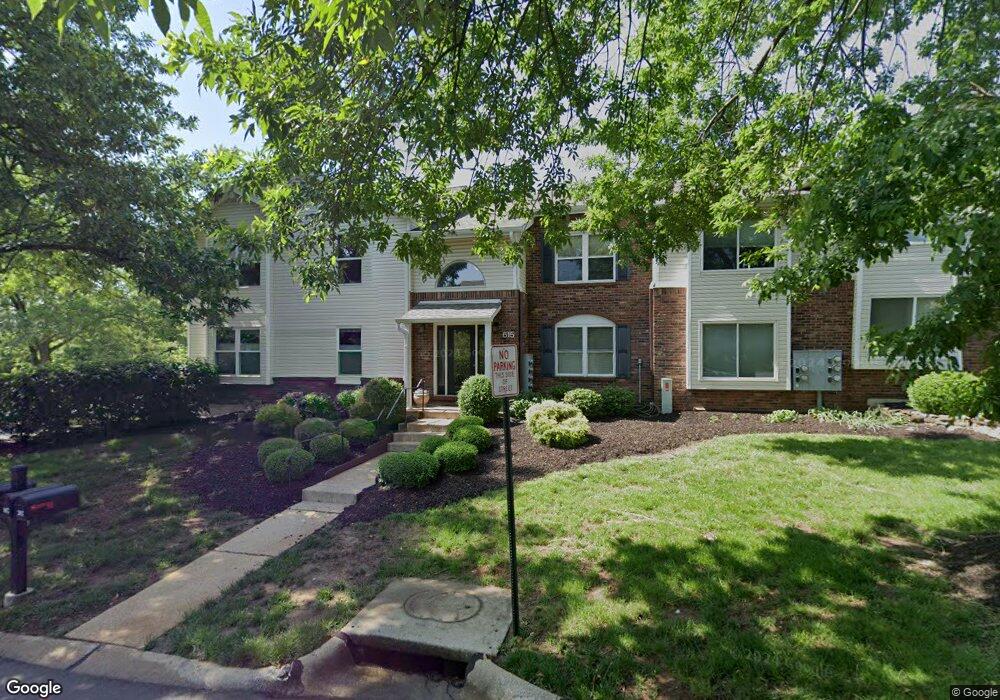
615 Pine Rdg Trls Ct Unit 202 Ballwin, MO 63021
Estimated Value: $208,000 - $224,000
2
Beds
2
Baths
1,100
Sq Ft
$195/Sq Ft
Est. Value
About This Home
This home is located at 615 Pine Rdg Trls Ct Unit 202, Ballwin, MO 63021 and is currently estimated at $214,051, approximately $194 per square foot. 615 Pine Rdg Trls Ct Unit 202 is a home located in St. Louis County with nearby schools including Woerther Elementary School, Selvidge Middle School, and Marquette Sr. High School.
Ownership History
Date
Name
Owned For
Owner Type
Purchase Details
Closed on
Nov 2, 2020
Sold by
Arnold Tiffany M and Cassandra J Taylor Legacy Trus
Bought by
Litton Linda M
Current Estimated Value
Purchase Details
Closed on
Dec 15, 2016
Sold by
Taylor Cassandra J
Bought by
Arnold Tiffany M and Cassandra J Taylor Legacy Trust
Purchase Details
Closed on
Jun 18, 2009
Sold by
Taylor Cassandra J
Bought by
Taylor Cassandra J and Cassandra J Taylor Living Trust
Purchase Details
Closed on
Jun 15, 1999
Sold by
Crockett Karin L
Bought by
Taylor Cassandra J
Home Financials for this Owner
Home Financials are based on the most recent Mortgage that was taken out on this home.
Original Mortgage
$50,000
Interest Rate
7.11%
Purchase Details
Closed on
Feb 6, 1999
Sold by
Crockett Karin L
Bought by
Crockett Matthew David and Crockett Sarah Jennifer
Create a Home Valuation Report for This Property
The Home Valuation Report is an in-depth analysis detailing your home's value as well as a comparison with similar homes in the area
Home Values in the Area
Average Home Value in this Area
Purchase History
| Date | Buyer | Sale Price | Title Company |
|---|---|---|---|
| Litton Linda M | $130,000 | Us Title Main | |
| Litton Linda M | -- | Us Title | |
| Arnold Tiffany M | -- | None Available | |
| Taylor Cassandra J | -- | None Available | |
| Taylor Cassandra J | $92,500 | -- | |
| Crockett Matthew David | -- | -- |
Source: Public Records
Mortgage History
| Date | Status | Borrower | Loan Amount |
|---|---|---|---|
| Previous Owner | Taylor Cassandra J | $50,000 |
Source: Public Records
Tax History
| Year | Tax Paid | Tax Assessment Tax Assessment Total Assessment is a certain percentage of the fair market value that is determined by local assessors to be the total taxable value of land and additions on the property. | Land | Improvement |
|---|---|---|---|---|
| 2025 | $2,014 | $33,460 | $10,030 | $23,430 |
| 2024 | $2,014 | $28,560 | $5,230 | $23,330 |
| 2023 | $2,014 | $28,560 | $5,230 | $23,330 |
| 2022 | $1,953 | $25,730 | $8,360 | $17,370 |
| 2021 | $1,939 | $25,730 | $8,360 | $17,370 |
| 2020 | $2,006 | $25,400 | $7,520 | $17,880 |
| 2019 | $2,014 | $25,400 | $7,520 | $17,880 |
| 2018 | $1,793 | $21,280 | $3,340 | $17,940 |
| 2017 | $1,750 | $21,280 | $3,340 | $17,940 |
| 2016 | $1,966 | $23,030 | $5,230 | $17,800 |
| 2015 | $1,927 | $23,030 | $5,230 | $17,800 |
| 2014 | $1,827 | $21,280 | $5,090 | $16,190 |
Source: Public Records
Map
Nearby Homes
- 604 Pine Ridge Trails Ct Unit 202
- 760 Woodside Trails Dr Unit 203
- 873 Woodside Trails Dr Unit 853
- 1110 Kiefer Creek Rd
- 510 Charoak Dr
- 6 Pleasant Valley Dr
- 1155 Kiefer Creek Rd
- 1217 Kiefer Creek Rd
- 677 Rustic Valley Dr
- 713 Village Wood Ct
- 400 Woodrun Dr
- 700 Juniper Glen Ct
- 589 Wetherby Terrace Dr
- 533 Golfwood Dr
- 318 Statewood Dr
- 279 Aspen Village Dr
- 659 Castlecliff Rd
- 1410 Saint Paul Rd
- 857 Village Meadow Dr
- 1389 Red Oak Plantation Dr
- 615 Pine Rdg Trls Ct Unit 201
- 615 Pine Rdg Trls Ct Unit 101
- 615 Pine Rdg Trls Ct Unit 102
- 609 Pine Ridge Trails Ct Unit 203
- 609 Pine Ridge Trails Ct Unit 103
- 609 Pine Ridge Trails Ct Unit 104
- 609 Pine Rdg Trls Ct Unit 103
- 609 Pine Rdg Trls Ct Unit 203
- 609 Pine Rdg Trls Ct Unit 104
- 609 Pine Rdg Trls Ct Unit 204
- 615 Pine Ridge Trails Ct Unit 202
- 615 Pine Ridge Trails Ct Unit 101
- 615 Pine Ridge Trails Ct Unit 201
- 615 Pine Ridge Trails Ct
- 618 Pine Rdg Trls Ct Unit 103
- 618 Pine Rdg Trls Ct Unit 203
- 618 Pine Rdg Trls Ct Unit 204
- 618 Pine Rdg Trls Ct Unit 104
- 618 Pine Ridge Trails Ct Unit 203
- 618 Pine Ridge Trails Ct Unit 103
Your Personal Tour Guide
Ask me questions while you tour the home.