615 Platt St Bridgeport, CT 06606
North End NeighborhoodEstimated Value: $339,000 - $382,000
3
Beds
1
Bath
1,152
Sq Ft
$315/Sq Ft
Est. Value
About This Home
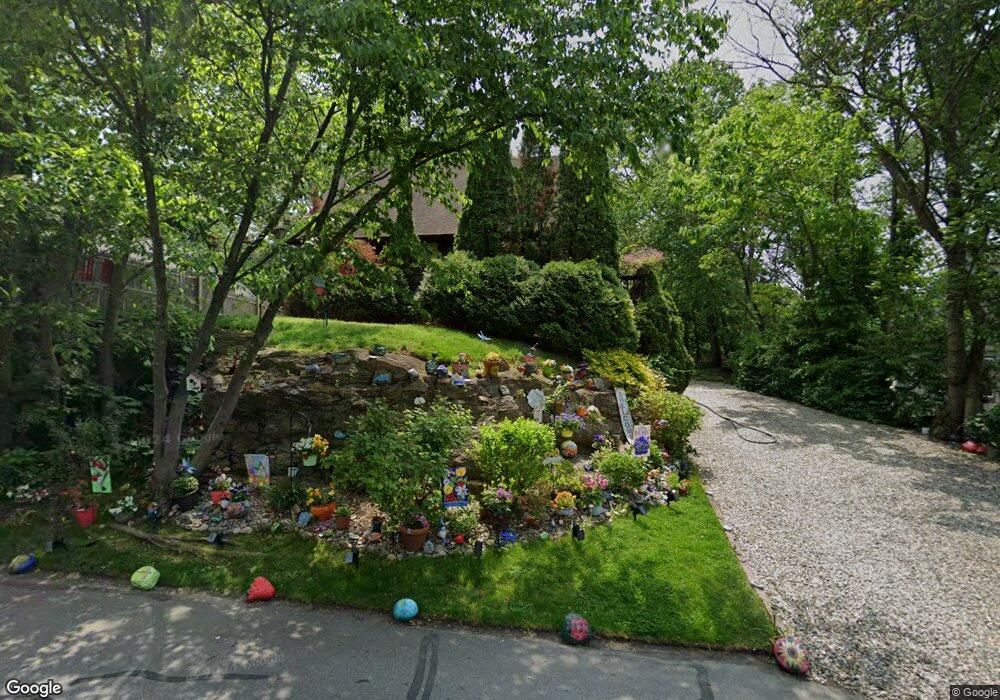
This home is located at 615 Platt St, Bridgeport, CT 06606 and is currently estimated at $363,030, approximately $315 per square foot. 615 Platt St is a home located in Fairfield County with nearby schools including Wilbur L. Cross Elementary School, Central High School, and St Andrew School.
Ownership History
Date
Name
Owned For
Owner Type
Purchase Details
Closed on
Feb 12, 2020
Sold by
Rocco Miguel
Bought by
Rocco Miguel and Rocco Tanja
Current Estimated Value
Purchase Details
Closed on
Jul 13, 2007
Sold by
Marsh Marlene
Bought by
Rucca Miguel
Home Financials for this Owner
Home Financials are based on the most recent Mortgage that was taken out on this home.
Original Mortgage
$217,000
Interest Rate
6.48%
Purchase Details
Closed on
Sep 9, 2005
Sold by
Waller Gary
Bought by
Marsh Marlene
Home Financials for this Owner
Home Financials are based on the most recent Mortgage that was taken out on this home.
Original Mortgage
$152,000
Interest Rate
9.12%
Purchase Details
Closed on
May 21, 1996
Sold by
Hankins Horace R and Lake Wendy S
Bought by
Waller Gary F
Purchase Details
Closed on
May 12, 1989
Sold by
Eddy Kathleen
Bought by
Hankins Horace
Create a Home Valuation Report for This Property
The Home Valuation Report is an in-depth analysis detailing your home's value as well as a comparison with similar homes in the area
Home Values in the Area
Average Home Value in this Area
Purchase History
| Date | Buyer | Sale Price | Title Company |
|---|---|---|---|
| Rocco Miguel | -- | None Available | |
| Rocco Miguel | -- | None Available | |
| Rucca Miguel | $217,000 | -- | |
| Rucca Miguel | $217,000 | -- | |
| Marsh Marlene | $160,000 | -- | |
| Marsh Marlene | $160,000 | -- | |
| Waller Gary F | $67,000 | -- | |
| Waller Gary F | $67,000 | -- | |
| Hankins Horace | $135,000 | -- |
Source: Public Records
Mortgage History
| Date | Status | Borrower | Loan Amount |
|---|---|---|---|
| Previous Owner | Hankins Horace | $217,000 | |
| Previous Owner | Hankins Horace | $152,000 |
Source: Public Records
Tax History Compared to Growth
Tax History
| Year | Tax Paid | Tax Assessment Tax Assessment Total Assessment is a certain percentage of the fair market value that is determined by local assessors to be the total taxable value of land and additions on the property. | Land | Improvement |
|---|---|---|---|---|
| 2025 | $6,116 | $140,750 | $69,430 | $71,320 |
| 2024 | $6,116 | $140,750 | $69,430 | $71,320 |
| 2023 | $6,116 | $140,750 | $69,430 | $71,320 |
| 2022 | $6,116 | $140,750 | $69,430 | $71,320 |
| 2021 | $6,116 | $140,750 | $69,430 | $71,320 |
| 2020 | $5,505 | $101,970 | $42,070 | $59,900 |
| 2019 | $5,505 | $101,970 | $42,070 | $59,900 |
| 2018 | $5,544 | $101,970 | $42,070 | $59,900 |
| 2017 | $5,544 | $101,970 | $42,070 | $59,900 |
| 2016 | $5,544 | $101,970 | $42,070 | $59,900 |
| 2015 | $5,279 | $125,100 | $42,430 | $82,670 |
| 2014 | $5,279 | $125,100 | $42,430 | $82,670 |
Source: Public Records
Map
Nearby Homes
- 675 Platt St
- 54 Agnes St
- 500 Woodlawn Avenue Extension
- 65 Clearview Dr
- 814 Platt St
- 365 Platt St
- 238 Griffin Ave
- 355 Exeter St
- 213 Exeter St
- 219 Exeter St
- 25 Broadway
- 285 Alba Ave
- 410 Alba Ave
- 123 Exeter St
- 7 Stone Ridge Rd
- 330 Oakwood St
- 354 Beechmont Ave
- 26 Karen Ct Unit A
- 215 Overland Ave
- 45 Stevens St Unit 2
- 625 Platt St
- 630 Platt St
- 610 Platt St
- 993 Chopsey Hill Rd
- 645 Platt St
- 642 Platt St
- 28 Valley Cir
- 981 Chopsey Hill Rd
- 46 Valley Cir
- 660 Platt St
- 655 Platt St
- 980 Chopsey
- 16 Valley Cir
- 60 Valley Cir
- 991 Chopsey Hill Rd
- 1026 Chopsey Hill Rd
- 980 Chopsey Hill Rd
- 76 Valley Cir
- 672 Platt St
- 992 Chopsey Hill Rd