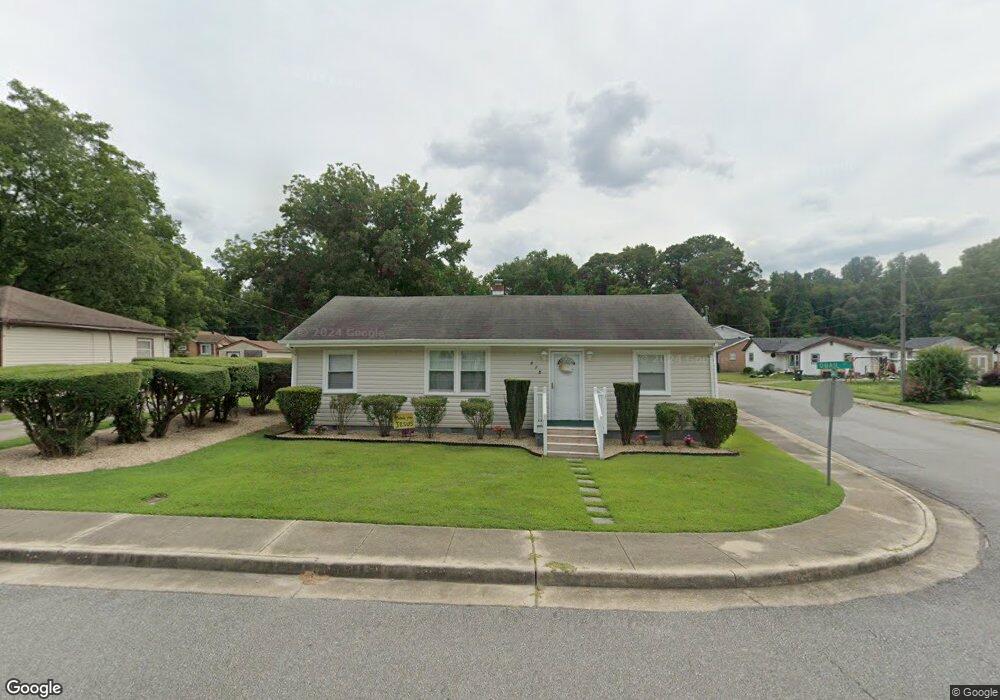
615 Quail St Smithfield, VA 23430
Estimated Value: $183,003 - $283,000
3
Beds
2
Baths
1,152
Sq Ft
$195/Sq Ft
Est. Value
About This Home
This home is located at 615 Quail St, Smithfield, VA 23430 and is currently estimated at $224,251, approximately $194 per square foot. 615 Quail St is a home located in Isle of Wight County with nearby schools including Carrollton Elementary School, Smithfield Middle School, and Smithfield High School.
Ownership History
Date
Name
Owned For
Owner Type
Purchase Details
Closed on
Jul 31, 2015
Current Estimated Value
Purchase Details
Closed on
Mar 6, 2013
Sold by
Virginia Commonwealth Bank
Purchase Details
Closed on
Jan 16, 2013
Purchase Details
Closed on
Mar 13, 2007
Purchase Details
Closed on
Dec 1, 2005
Purchase Details
Closed on
Sep 9, 2005
Purchase Details
Closed on
Sep 3, 2004
Purchase Details
Closed on
Feb 2, 2004
Purchase Details
Closed on
May 29, 1996
Create a Home Valuation Report for This Property
The Home Valuation Report is an in-depth analysis detailing your home's value as well as a comparison with similar homes in the area
Home Values in the Area
Average Home Value in this Area
Purchase History
| Date | Buyer | Sale Price | Title Company |
|---|---|---|---|
| -- | $141,200 | -- | |
| -- | $32,500 | -- | |
| -- | $35,000 | -- | |
| -- | -- | -- | |
| -- | -- | -- | |
| -- | $60,000 | -- | |
| -- | $44,100 | -- | |
| -- | $66,300 | -- | |
| -- | -- | -- |
Source: Public Records
Tax History
| Year | Tax Paid | Tax Assessment Tax Assessment Total Assessment is a certain percentage of the fair market value that is determined by local assessors to be the total taxable value of land and additions on the property. | Land | Improvement |
|---|---|---|---|---|
| 2025 | $961 | $124,000 | $15,000 | $109,000 |
| 2024 | $905 | $124,000 | $15,000 | $109,000 |
| 2023 | $934 | $124,000 | $15,000 | $109,000 |
| 2022 | $984 | $109,400 | $15,000 | $94,400 |
| 2021 | $984 | $109,400 | $15,000 | $94,400 |
| 2020 | $984 | $109,400 | $15,000 | $94,400 |
| 2019 | $984 | $109,400 | $15,000 | $94,400 |
| 2018 | $879 | $97,000 | $15,000 | $82,000 |
| 2016 | $897 | $97,000 | $15,000 | $82,000 |
| 2015 | $663 | $97,000 | $15,000 | $82,000 |
| 2014 | $663 | $69,500 | $15,000 | $54,500 |
| 2013 | -- | $69,500 | $15,000 | $54,500 |
Source: Public Records
Map
Nearby Homes
- 610 Quail St
- TBD Quail St
- 212 Middle St
- 300 East St
- 330 Main St
- 328 Main St
- Lt 1 Clay St
- Lt 2 Clay St
- .26 ac Clay St
- Lot 21 Courthouse Hwy
- 158 Riverview Ave
- 345 S Church St
- 351 S Church St
- 403 S Church St
- 405 S Church St
- 19 AC Hilltop Ln
- 103 the MacHrie
- 140 Ayrshire Loop
- 208 Saint Andrews
- 200 Saint Andrews
Your Personal Tour Guide
Ask me questions while you tour the home.