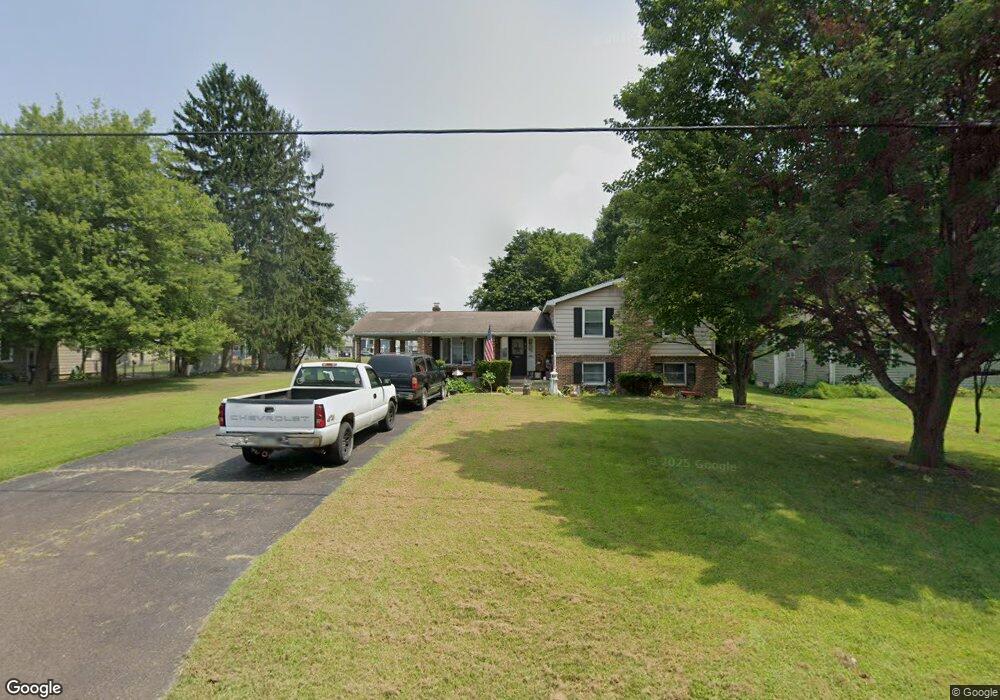
615 Race St Nescopeck, PA 18635
Estimated Value: $223,208 - $428,000
--
Bed
--
Bath
2,100
Sq Ft
$151/Sq Ft
Est. Value
About This Home
This home is located at 615 Race St, Nescopeck, PA 18635 and is currently estimated at $316,802, approximately $150 per square foot. 615 Race St is a home with nearby schools including Central Columbia Elementary School, Central Columbia Middle School, and Central Columbia Senior High School.
Ownership History
Date
Name
Owned For
Owner Type
Purchase Details
Closed on
May 18, 2023
Sold by
Sobolesky Joel E
Bought by
Roberts John and Mclaughlin Amanda
Current Estimated Value
Purchase Details
Closed on
May 17, 2023
Sold by
Sobolesky Joel E
Bought by
Roberts John and Mclaughlin Amanda
Purchase Details
Closed on
Oct 5, 2012
Sold by
Harmon Brent M and Harmon Brenda L
Bought by
Sobolesky Joel E and Yutko Sobolesky Etta L
Home Financials for this Owner
Home Financials are based on the most recent Mortgage that was taken out on this home.
Original Mortgage
$123,200
Interest Rate
3.66%
Mortgage Type
New Conventional
Purchase Details
Closed on
Aug 2, 2007
Sold by
Criswll Brett A and Criswell Stephanie S
Bought by
Harmon Brent M and Harmon Brenda L
Home Financials for this Owner
Home Financials are based on the most recent Mortgage that was taken out on this home.
Original Mortgage
$135,200
Interest Rate
6.71%
Mortgage Type
New Conventional
Create a Home Valuation Report for This Property
The Home Valuation Report is an in-depth analysis detailing your home's value as well as a comparison with similar homes in the area
Home Values in the Area
Average Home Value in this Area
Purchase History
| Date | Buyer | Sale Price | Title Company |
|---|---|---|---|
| Roberts John | $153,500 | Exact Abstract | |
| Roberts John | $153,500 | Exact Abstract | |
| Sobolesky Joel E | $176,000 | First American Title Ins Co | |
| Harmon Brent M | $169,000 | None Available |
Source: Public Records
Mortgage History
| Date | Status | Borrower | Loan Amount |
|---|---|---|---|
| Previous Owner | Sobolesky Joel E | $123,200 | |
| Previous Owner | Harmon Brent M | $135,200 |
Source: Public Records
Tax History Compared to Growth
Tax History
| Year | Tax Paid | Tax Assessment Tax Assessment Total Assessment is a certain percentage of the fair market value that is determined by local assessors to be the total taxable value of land and additions on the property. | Land | Improvement |
|---|---|---|---|---|
| 2025 | $3,518 | $51,492 | $0 | $0 |
| 2024 | $3,430 | $51,492 | $4,260 | $47,232 |
| 2023 | $3,275 | $51,492 | $4,260 | $47,232 |
| 2022 | $3,275 | $51,492 | $4,260 | $47,232 |
| 2021 | $3,275 | $51,492 | $4,260 | $47,232 |
| 2020 | $3,164 | $51,492 | $4,260 | $47,232 |
| 2019 | $3,099 | $51,492 | $4,260 | $47,232 |
| 2018 | $3,099 | $51,492 | $4,260 | $47,232 |
| 2017 | $3,061 | $51,492 | $4,260 | $47,232 |
| 2016 | -- | $51,492 | $4,260 | $47,232 |
| 2015 | -- | $51,492 | $4,260 | $47,232 |
| 2014 | -- | $51,492 | $4,260 | $47,232 |
Source: Public Records
Map
Nearby Homes
- LOT 2B W 5th St
- 308 E 5th St
- LOT 4A West St
- LOT 5A West St
- LOT 4B West St
- LOT 5B West St
- 328 W 3rd St
- 222 E 4th St
- 509 Mary St
- 25 Mifflin Terrace
- 17 Estate Way
- 13 Estate Way
- 21 Estate Way
- 330 E 5th St
- 0 Columbia Blvd Unit 20-98472
- 0 Columbia Blvd Unit 20-94407
- 45 Amron Dr
- 7035 Scenic Dr
- 6970 Scenic Dr
- 6205 Main St