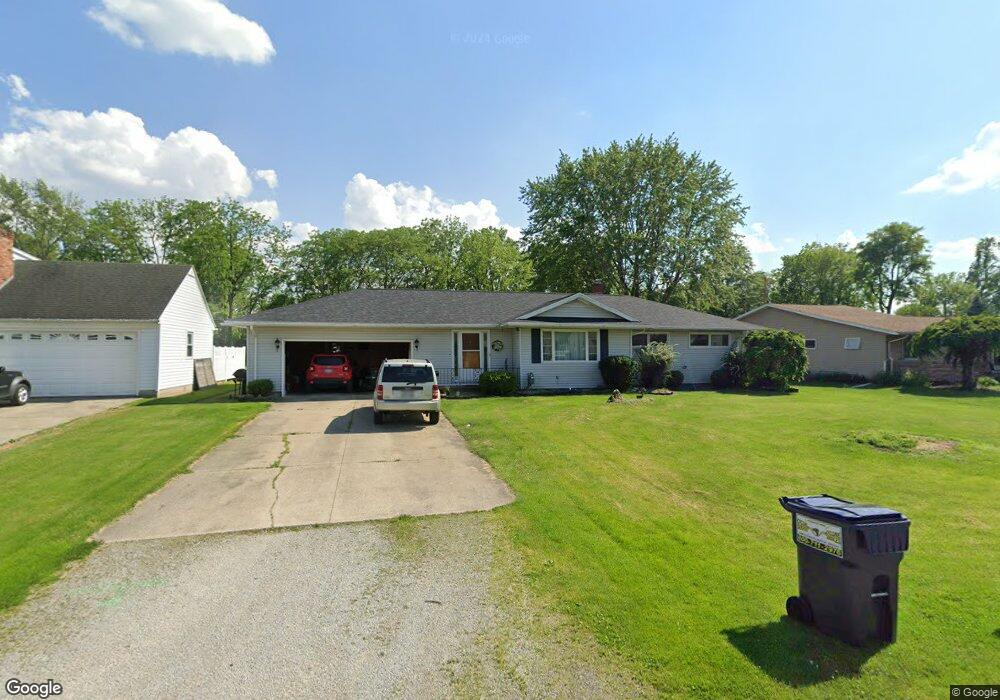
615 Sunset Ln Fremont, OH 43420
Estimated Value: $159,000 - $179,000
3
Beds
2
Baths
1,312
Sq Ft
$128/Sq Ft
Est. Value
About This Home
This home is located at 615 Sunset Ln, Fremont, OH 43420 and is currently estimated at $168,228, approximately $128 per square foot. 615 Sunset Ln is a home located in Sandusky County with nearby schools including Fremont Ross High School, St. Ann Catholic School, and St. Joseph School.
Ownership History
Date
Name
Owned For
Owner Type
Purchase Details
Closed on
Jul 26, 2005
Sold by
Rohm Rose M
Bought by
Kopcak George J and Kopcak Clara J
Current Estimated Value
Home Financials for this Owner
Home Financials are based on the most recent Mortgage that was taken out on this home.
Original Mortgage
$107,000
Outstanding Balance
$56,497
Interest Rate
5.74%
Mortgage Type
Fannie Mae Freddie Mac
Estimated Equity
$111,731
Purchase Details
Closed on
Jan 3, 2003
Sold by
Mezinger Michael S
Bought by
Rohm Rose M
Home Financials for this Owner
Home Financials are based on the most recent Mortgage that was taken out on this home.
Original Mortgage
$76,000
Interest Rate
6.13%
Mortgage Type
New Conventional
Purchase Details
Closed on
May 17, 1996
Sold by
Decker Frederick A
Bought by
Mezinger Michael S and Mezinger Pamela M
Home Financials for this Owner
Home Financials are based on the most recent Mortgage that was taken out on this home.
Original Mortgage
$68,000
Interest Rate
7.86%
Mortgage Type
New Conventional
Create a Home Valuation Report for This Property
The Home Valuation Report is an in-depth analysis detailing your home's value as well as a comparison with similar homes in the area
Home Values in the Area
Average Home Value in this Area
Purchase History
| Date | Buyer | Sale Price | Title Company |
|---|---|---|---|
| Kopcak George J | $102,750 | First American Title | |
| Rohm Rose M | $129,000 | -- | |
| Mezinger Michael S | $85,000 | -- |
Source: Public Records
Mortgage History
| Date | Status | Borrower | Loan Amount |
|---|---|---|---|
| Open | Kopcak George J | $107,000 | |
| Closed | Rohm Rose M | $76,000 | |
| Previous Owner | Mezinger Michael S | $68,000 |
Source: Public Records
Tax History Compared to Growth
Tax History
| Year | Tax Paid | Tax Assessment Tax Assessment Total Assessment is a certain percentage of the fair market value that is determined by local assessors to be the total taxable value of land and additions on the property. | Land | Improvement |
|---|---|---|---|---|
| 2024 | $1,774 | $47,150 | $8,260 | $38,890 |
| 2023 | $1,774 | $44,910 | $7,880 | $37,030 |
| 2022 | $1,796 | $44,910 | $7,880 | $37,030 |
| 2021 | $1,852 | $44,910 | $7,880 | $37,030 |
| 2020 | $1,577 | $37,600 | $7,880 | $29,720 |
| 2019 | $1,575 | $37,600 | $7,880 | $29,720 |
| 2018 | $1,578 | $37,600 | $7,880 | $29,720 |
| 2017 | $1,486 | $35,290 | $7,880 | $27,410 |
| 2016 | $1,309 | $35,290 | $7,880 | $27,410 |
| 2015 | $1,288 | $35,290 | $7,880 | $27,410 |
| 2014 | $1,349 | $35,210 | $11,480 | $23,730 |
| 2013 | $1,321 | $35,210 | $11,480 | $23,730 |
Source: Public Records
Map
Nearby Homes
- 1730 Port Clinton Rd Unit 33
- 1730 Port Clinton Rd
- 1730 Port Clinton Rd Unit 41
- 2100 Ohio 53
- 900 Spring St
- 711 Bloom Rd
- 0 Sean Dr
- Outlot A Sean Dr
- 711 Rawson Ave
- 1441 White Ave
- 1227 White Ave
- 612 2nd St
- 533 Sandusky Ave Unit 535
- 516 N Front St
- 433 Sandusky Ave
- 340 340 Sandusky Ave
- 427 N Clover St
- 1707 North St
- 1720 North St
- 224 Sandusky Ave Unit 226
- 607 Sunset Ln
- 621 Sunset Ln
- 612 Sunset Ln
- 631 Sunset Ln
- 606 Sunset Ln
- 620 Sunset Ln
- 626 Sunset Ln
- 1720 Port Clinton Rd
- 639 Sunset Ln
- 568 Sunset Ln
- 1714 Port Clinton Rd
- 1730 Port Clinton Rd Unit 16
- 1730 Port Clinton Rd Unit 42
- 1730 Port Clinton Rd Unit 24
- 1730 Port Clinton Rd Unit 20
- 1730 Port Clinton Rd Unit 10
- 1730 Port Clinton Rd Unit 45
- 1730 Port Clinton Rd Unit 39
- 1730 Port Clinton Rd Unit 23
- 1730 Port Clinton Rd Unit 55