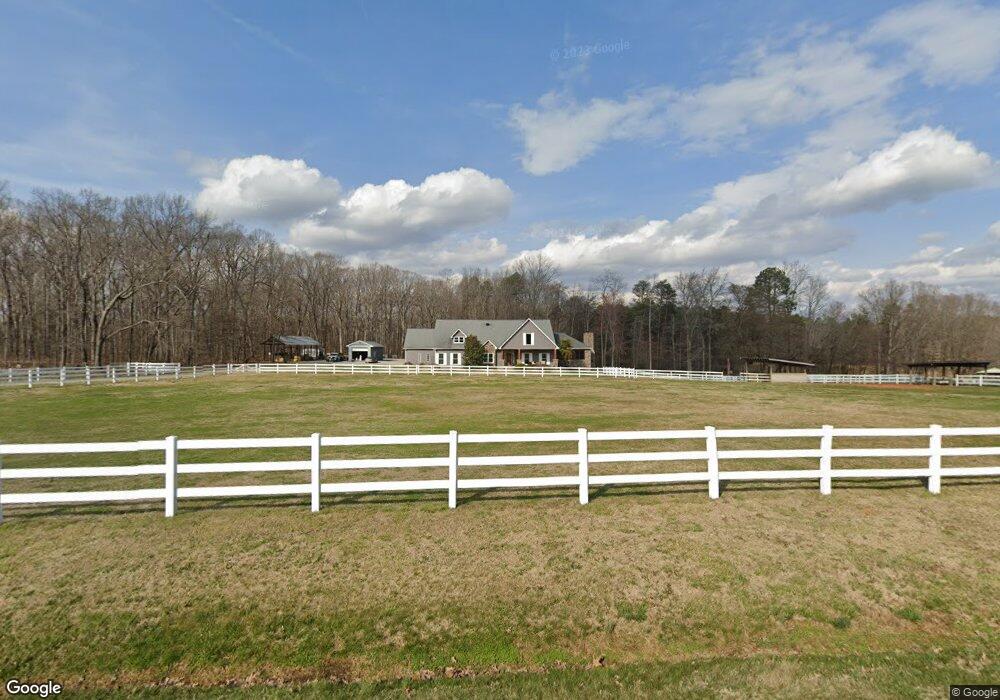
615 Trexler Loop Salisbury, NC 28144
Estimated Value: $489,000 - $920,271
3
Beds
3
Baths
3,511
Sq Ft
$203/Sq Ft
Est. Value
About This Home
This home is located at 615 Trexler Loop, Salisbury, NC 28144 and is currently estimated at $713,318, approximately $203 per square foot. 615 Trexler Loop is a home located in Rowan County with nearby schools including North Rowan Elementary School, North Rowan Middle School, and North Rowan High School.
Ownership History
Date
Name
Owned For
Owner Type
Purchase Details
Closed on
Jul 1, 2016
Sold by
Anderson Donald G and Anderson Nancy K
Bought by
Timberlake Robert C and Timberlake Penny L
Current Estimated Value
Home Financials for this Owner
Home Financials are based on the most recent Mortgage that was taken out on this home.
Original Mortgage
$400,000
Interest Rate
3.64%
Mortgage Type
Purchase Money Mortgage
Purchase Details
Closed on
Jul 22, 2014
Sold by
Anderson Donald G and Anderson Nancy K
Bought by
Anderson Donald G and Anderson Nancy K
Purchase Details
Closed on
Mar 12, 2014
Sold by
Hoben Jill A
Bought by
Anderson Donald G and Anderson Nancy K
Create a Home Valuation Report for This Property
The Home Valuation Report is an in-depth analysis detailing your home's value as well as a comparison with similar homes in the area
Purchase History
| Date | Buyer | Sale Price | Title Company |
|---|---|---|---|
| Timberlake Robert C | $500,000 | None Available | |
| Anderson Donald G | -- | None Available | |
| Anderson Donald G | -- | None Available | |
| Anderson Donald G | -- | None Available |
Source: Public Records
Mortgage History
| Date | Status | Borrower | Loan Amount |
|---|---|---|---|
| Closed | Timberlake Robert C | $400,000 |
Source: Public Records
Tax History
| Year | Tax Paid | Tax Assessment Tax Assessment Total Assessment is a certain percentage of the fair market value that is determined by local assessors to be the total taxable value of land and additions on the property. | Land | Improvement |
|---|---|---|---|---|
| 2025 | $4,545 | $683,388 | $125,139 | $558,249 |
| 2024 | $4,545 | $683,388 | $125,139 | $558,249 |
| 2023 | $4,318 | $649,258 | $125,139 | $524,119 |
| 2022 | $3,163 | $425,957 | $110,502 | $315,455 |
| 2021 | $3,163 | $425,957 | $110,502 | $315,455 |
| 2020 | $3,163 | $425,957 | $110,502 | $315,455 |
| 2019 | $3,163 | $425,957 | $110,502 | $315,455 |
| 2018 | $2,782 | $377,897 | $110,501 | $267,396 |
| 2017 | $2,782 | $377,897 | $110,501 | $267,396 |
| 2016 | $2,782 | $377,897 | $110,501 | $267,396 |
| 2015 | $2,825 | $377,897 | $110,501 | $267,396 |
| 2014 | $2,074 | $290,084 | $35,186 | $254,898 |
Source: Public Records
Map
Nearby Homes
- 110 Pantego Place
- 115 Pantego Place
- 114 Pantego Place
- 123 Pantego Place
- 122 Pantego Place
- 127 Pantego Place
- 1490 Carthage Dr
- 133 Pantego Place
- 147 Aberdeen Dr
- 136 Pantego Place
- 201 Pantego Place
- 115 Birkdale Dr
- 111 Birkdale Dr
- 205 Pantego Place
- 102 Polo Dr
- 151 Birkdale Dr Unit 18
- 1480 Carthage Dr
- 1450 Carthage Dr
- 1470 Carthage Dr
- 217 Pantego Place
Your Personal Tour Guide
Ask me questions while you tour the home.