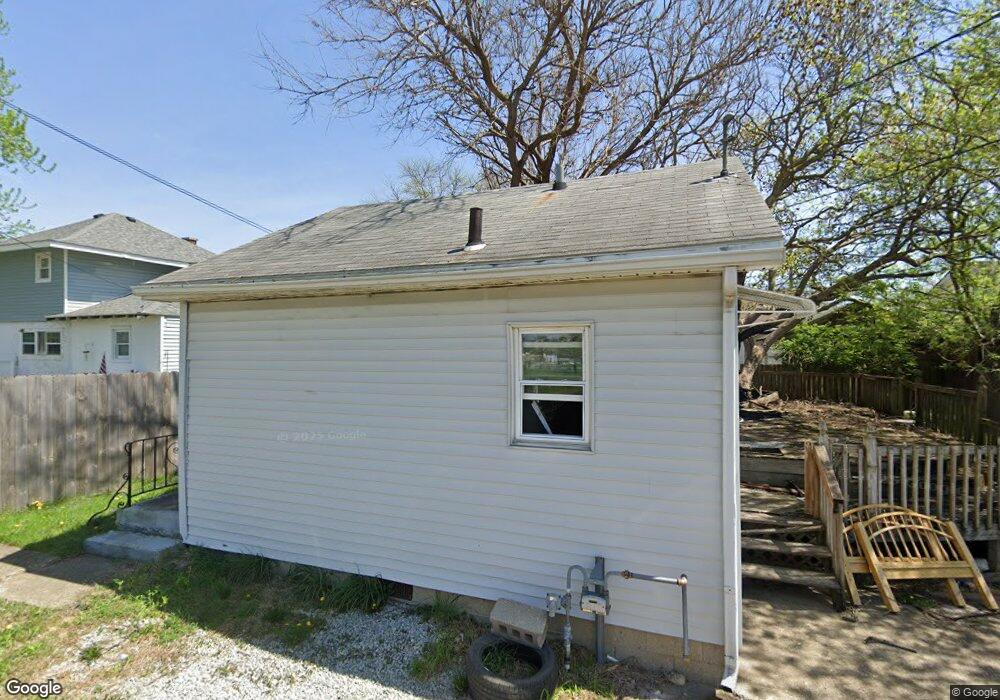
615 W 10th St Anderson, IN 46016
Estimated Value: $62,315 - $75,000
2
Beds
1
Bath
616
Sq Ft
$115/Sq Ft
Est. Value
About This Home
This home is located at 615 W 10th St, Anderson, IN 46016 and is currently estimated at $70,829, approximately $114 per square foot. 615 W 10th St is a home located in Madison County with nearby schools including Tenth Street Elementary School, Highland Middle School, and Anderson High School.
Ownership History
Date
Name
Owned For
Owner Type
Purchase Details
Closed on
Sep 5, 2025
Sold by
Riparian Vpc Indiana Sfr Portfolio Llc
Bought by
Slemp James C and Shockley Doris L
Current Estimated Value
Purchase Details
Closed on
Apr 15, 2025
Sold by
Alec Cay Llc
Bought by
Riparian Vpc Indiana Sfr Portfolio Llc
Purchase Details
Closed on
Mar 15, 2018
Sold by
Trinity Llc
Bought by
Alec Cay Llc
Purchase Details
Closed on
Apr 18, 2014
Sold by
Rcs Holding Llc
Bought by
Trinity Lt Holding Llc
Purchase Details
Closed on
Jan 1, 2008
Sold by
Black Linden L
Bought by
Rcs Holdings Llc
Purchase Details
Closed on
Oct 23, 2007
Sold by
Wellington Investments Llc
Bought by
Black Linden
Create a Home Valuation Report for This Property
The Home Valuation Report is an in-depth analysis detailing your home's value as well as a comparison with similar homes in the area
Home Values in the Area
Average Home Value in this Area
Purchase History
| Date | Buyer | Sale Price | Title Company |
|---|---|---|---|
| Slemp James C | -- | Absolute Title Inc | |
| Riparian Vpc Indiana Sfr Portfolio Llc | -- | Titlevest Agency Llc | |
| Alec Cay Llc | -- | -- | |
| Trinity Lt Holding Llc | -- | -- | |
| Rcs Holdings Llc | -- | -- | |
| Black Linden | -- | -- |
Source: Public Records
Tax History Compared to Growth
Tax History
| Year | Tax Paid | Tax Assessment Tax Assessment Total Assessment is a certain percentage of the fair market value that is determined by local assessors to be the total taxable value of land and additions on the property. | Land | Improvement |
|---|---|---|---|---|
| 2024 | $696 | $31,300 | $7,400 | $23,900 |
| 2023 | $645 | $28,700 | $7,000 | $21,700 |
| 2022 | $647 | $28,800 | $6,900 | $21,900 |
| 2021 | $794 | $35,200 | $6,800 | $28,400 |
| 2020 | $797 | $35,200 | $6,500 | $28,700 |
| 2019 | $780 | $34,400 | $6,500 | $27,900 |
| 2018 | $1,440 | $31,900 | $6,500 | $25,400 |
| 2017 | $638 | $31,800 | $6,500 | $25,300 |
| 2016 | $638 | $31,800 | $6,500 | $25,300 |
| 2014 | $542 | $27,000 | $7,500 | $19,500 |
| 2013 | $542 | $27,000 | $7,500 | $19,500 |
Source: Public Records
Map
Nearby Homes